Answered step by step
Verified Expert Solution
Question
1 Approved Answer
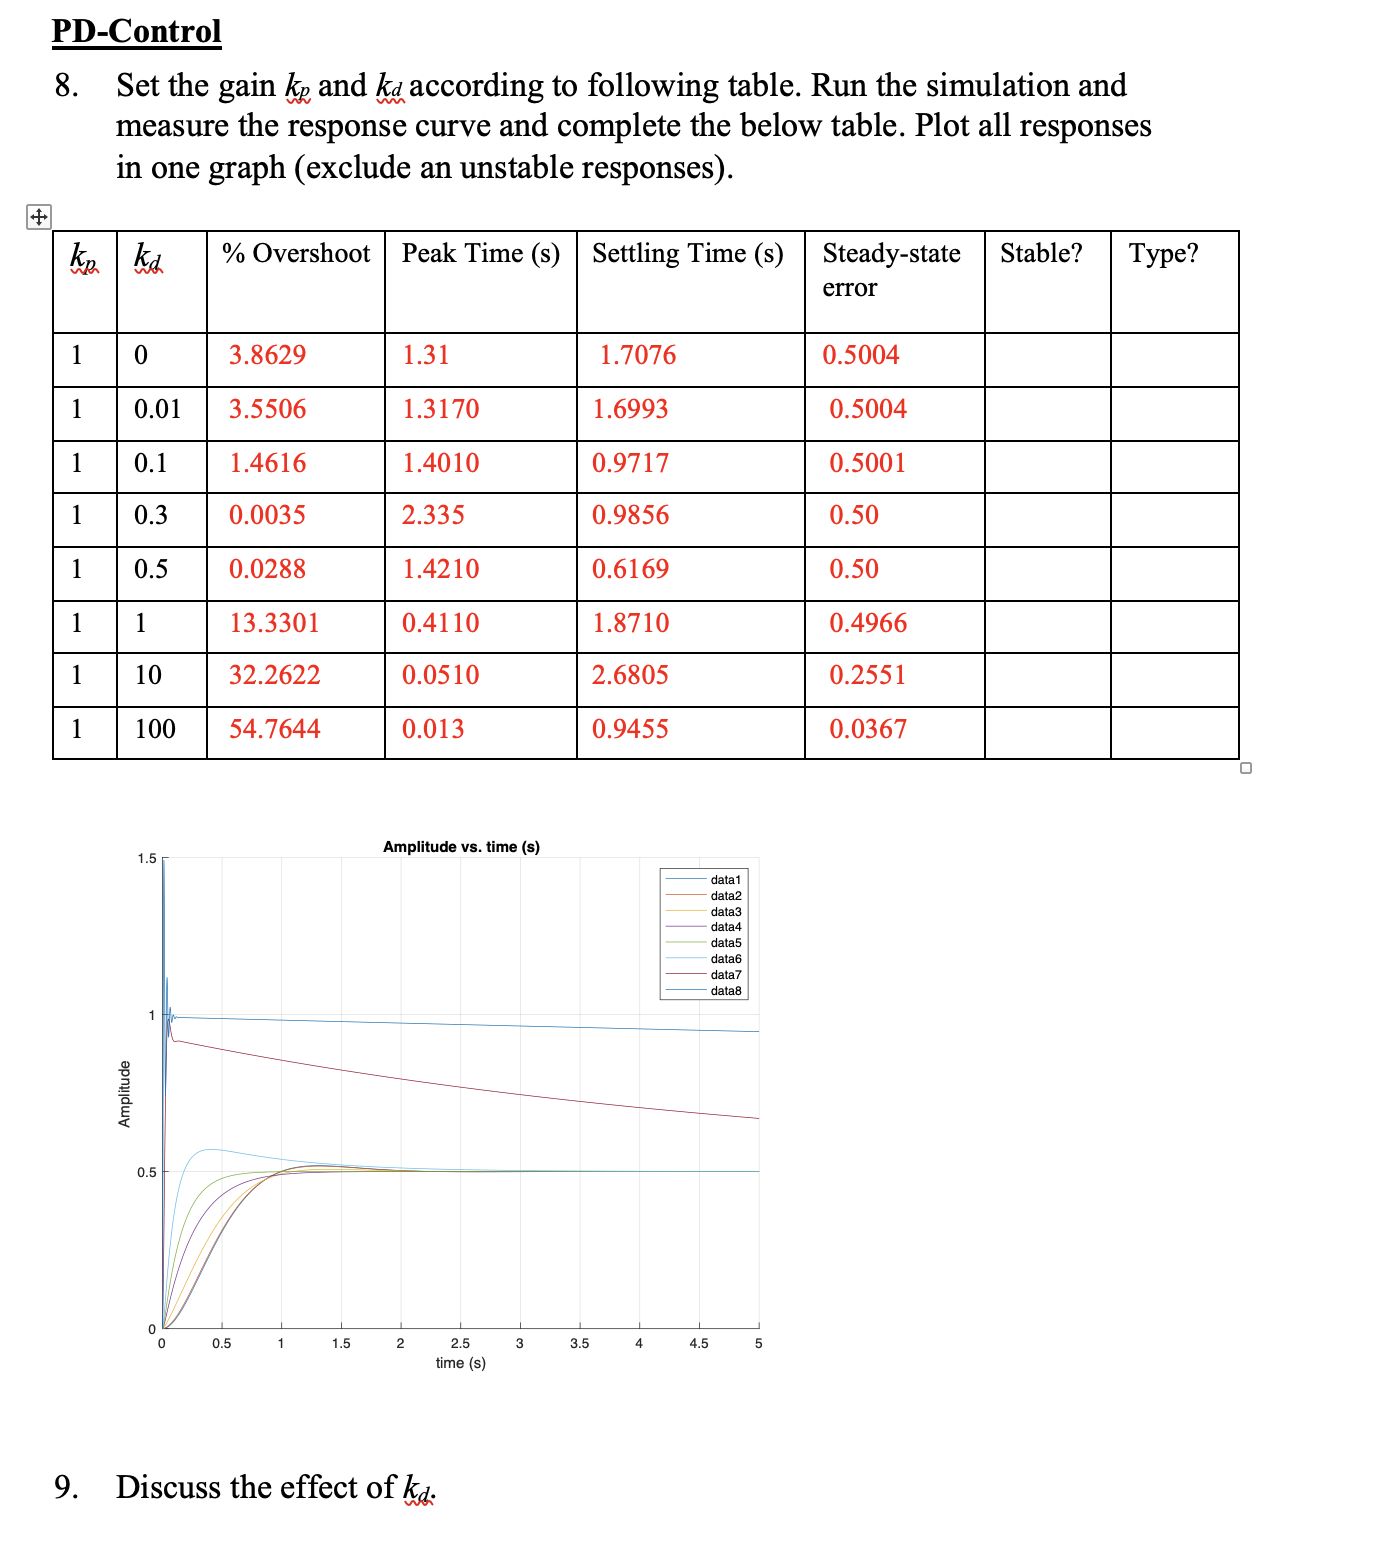
PD-Control 8. Set the gain kg and ka according to following table. Run the simulation and measure the response curve and complete the below

PD-Control 8. Set the gain kg and ka according to following table. Run the simulation and measure the response curve and complete the below table. Plot all responses in one graph (exclude an unstable responses). kp kd % Overshoot Peak Time (s) Settling Time (s) Steady-state Stable? Type? error 1 0 3.8629 1.31 1.7076 0.5004 1 0.01 3.5506 1.3170 1.6993 0.5004 1 0.1 1.4616 1.4010 0.9717 0.5001 1 0.3 0.0035 2.335 0.9856 0.50 1 0.5 0.0288 1.4210 0.6169 0.50 1 1 13.3301 0.4110 1.8710 0.4966 1 32.2622 0.0510 2.6805 0.2551 1 100 54.7644 0.013 0.9455 0.0367 Amplitude 0.5 1.5 Amplitude vs. time (s) data1 data2 data3 data4 data5 data6 data7 data8 0 0.5 1 1.5 2 2.5 3 3.5 4 4.5 5 time (s) 9. Discuss the effect of kd
Step by Step Solution
There are 3 Steps involved in it
Step: 1

Get Instant Access to Expert-Tailored Solutions
See step-by-step solutions with expert insights and AI powered tools for academic success
Step: 2

Step: 3

Ace Your Homework with AI
Get the answers you need in no time with our AI-driven, step-by-step assistance
Get Started


