

Question: Perform a capability analysis on each machine. The process has a lower limit of 95. Comment on the results. Are the machines capable? What sigma
- Perform a capability analysis on each machine. The process has a lower limit of 95. Comment on the results. Are the machines capable? What sigma level?
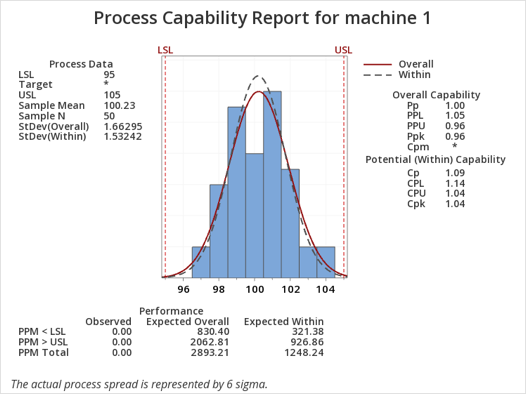
Process Capability Report for machine 1 LSL USL Process Data LSL 95 Target USL 105 Sample Mean 100.23 Sample N 50 StDev(Overall) 1.66295 StDev Within) 1.53242 Overall Within Overall Capability Pp 1.00 PPL 1.05 PPU 0.96 Ppk 0.96 pm Potential (Within) Capability 1.09 CPL 1.14 CPU 1.04 pk 1.04 96 98 100 102 104 PPM
Step by Step Solution
There are 3 Steps involved in it

Get step-by-step solutions from verified subject matter experts