Answered step by step
Verified Expert Solution
Question
1 Approved Answer
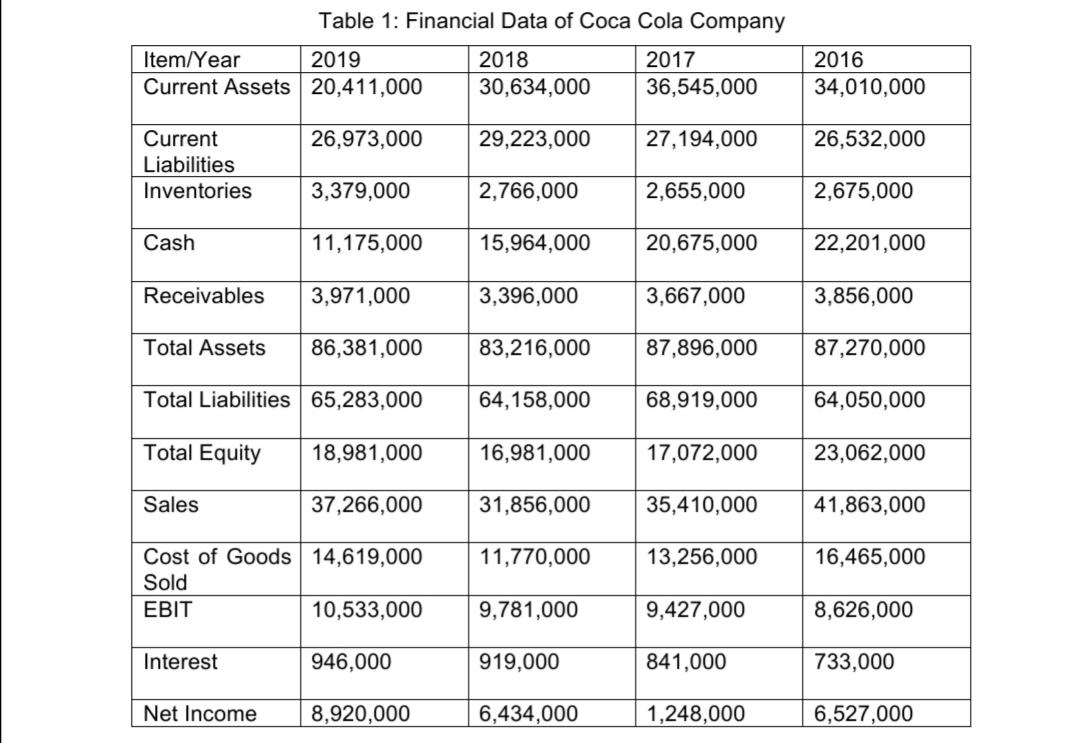
Perform a comprehensive financial ratio trend analysis of the company covering: i. Profitability ratios ii. Liquidity ratios iii. Debt ratios iv. Asset efficiency ratios E.
Perform a comprehensive financial ratio trend analysis of the company covering:
i. Profitability ratios
ii. Liquidity ratios
iii. Debt ratios
iv. Asset efficiency ratios
E. Apply the DuPont system of analysis to determine and analyse key drivers of shareholder and compare
DuPont insights with those of financial ratio analysis.

Item/Year Table 1: Financial Data of Coca Cola Company 2019 Current Assets 20,411,000 2018 30,634,000 2017 36,545,000 2016 34,010,000 Current 26,973,000 29,223,000 27,194,000 26,532,000 Liabilities Inventories 3,379,000 2,766,000 2,655,000 2,675,000 Cash 11,175,000 15,964,000 20,675,000 22,201,000 Receivables 3,971,000 3,396,000 3,667,000 3,856,000 Total Assets 86,381,000 83,216,000 87,896,000 87,270,000 Total Liabilities 65,283,000 64,158,000 68,919,000 64,050,000 Total Equity 18,981,000 16,981,000 17,072,000 23,062,000 Sales 37,266,000 31,856,000 35,410,000 41,863,000 Cost of Goods 14,619,000 11,770,000 13,256,000 16,465,000 Sold EBIT 10,533,000 9,781,000 9,427,000 8,626,000 Interest 946,000 919,000 841,000 733,000 Net Income 8,920,000 6,434,000 1,248,000 6,527,000
Step by Step Solution
There are 3 Steps involved in it
Step: 1
Based on the data in the table heres a financial ratio trend analysis for CocaCola Company covering the period 2 016 to 2019 Profitability Ratios Net Profit Margin This ratio shows a significant decli...
Get Instant Access to Expert-Tailored Solutions
See step-by-step solutions with expert insights and AI powered tools for academic success
Step: 2

Step: 3

Ace Your Homework with AI
Get the answers you need in no time with our AI-driven, step-by-step assistance
Get Started


