

Answered step by step
Verified Expert Solution
Question
1 Approved Answer
perform a horizontal analysis for 2018,2019,2020 B D E G H Horizontal Analysis 2018 2019 2020 Base Year 2018 232,887,000 173,183,000 59,704,000 47,283,000 12,421,000 977,000
perform a horizontal analysis for 2018,2019,2020 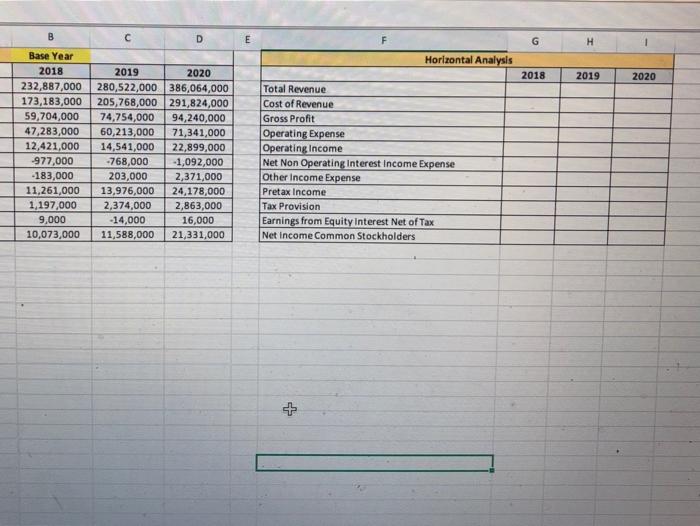
B D E G H Horizontal Analysis 2018 2019 2020 Base Year 2018 232,887,000 173,183,000 59,704,000 47,283,000 12,421,000 977,000 -183,000 11,261,000 1,197,000 9,000 10,073,000 2019 2020 280,522,000 386,064,000 205,768,000 291,824,000 74,754,000 94,240,000 60,213,000 71,341,000 14,541,000 22,899,000 -768,000 -1,092,000 203,000 2,371,000 13,976,000 24,178,000 2,374,000 2,863,000 -14,000 16,000 11,588,000 21,331,000 Total Revenue Cost of Revenue Gross Profit Operating Expense Operating Income Net Non Operating Interest Income Expense Other Income Expense Pretax income Tax Provision Earnings from Equity Interest Net of Tax Net Income Common Stockholders Step by Step Solution
There are 3 Steps involved in it
Step: 1

Get Instant Access to Expert-Tailored Solutions
See step-by-step solutions with expert insights and AI powered tools for academic success
Step: 2

Step: 3
Ace Your Homework with AI
Get the answers you need in no time with our AI-driven, step-by-step assistance
Get Started
International Financial Reporting Standards ImplementationA Global Experience
Authors: Mohammad Nurunnabi
1st Edition
1801174415, 9781801174411