Answered step by step
Verified Expert Solution
Question
1 Approved Answer
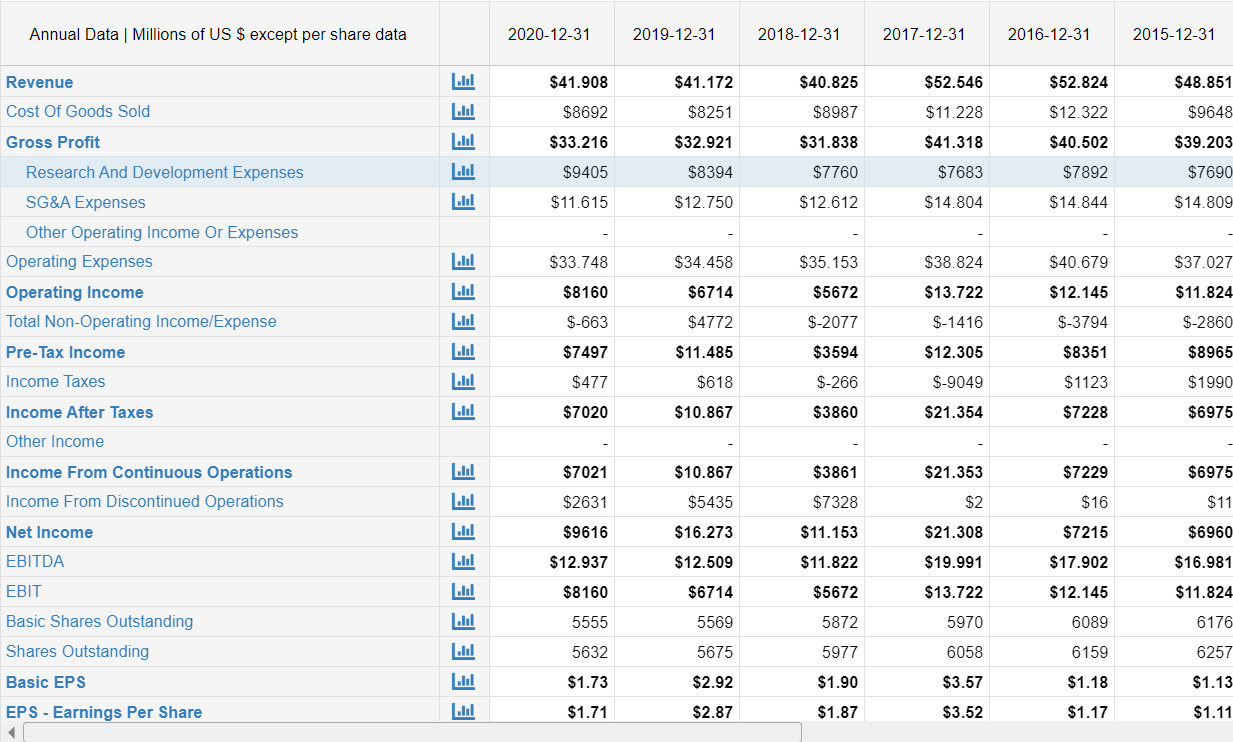
Perform a regression analysis of the relationship between changes in the research and development expenses and the stock return. Annual Data | Millions of US
Perform a regression analysis of the relationship between changes in the research and development expenses and the stock return.

Annual Data | Millions of US $ except per share data 2020-12-31 2019-12-31 2018-12-31 2017-12-31 2016-12-31 2015-12-31 Revenue $41.908 $41.172 $52.546 $52.824 $48.851 $40.825 $8987 Cost Of Goods Sold $8692 $8251 $12.322 $9648 $11.228 $41.318 Gross Profit EEEEE $33.216 $32.921 $31.838 $40.502 $39.203 $9405 $8394 $7760 $7683 $7892 $7690 $11.615 $12.750 $12.612 $14.804 $14.844 $14.809 Research And Development Expenses SG&A Expenses Other Operating Income Or Expenses Operating Expenses Operating Income Total Non-Operating Income/Expense Pre-Tax Income $33.748 $34.458 $35.153 $38.824 $40.679 $37.027 $8160 $6714 $5672 $13.722 $12.145 $11.824 $-663 $4772 $-2077 $-1416 $-3794 $-2860 E E E E E E $7497 $11.485 $3594 $12.305 $8351 $8965 Income Taxes $477 $618 $-266 $-9049 $1123 $1990 Income After Taxes $7020 $10.867 $3860 $21.354 $7228 $6975 Other Income $7021 $10.867 $3861 $21.353 $7229 $6975 Income From Continuous Operations Income From Discontinued Operations $2631 $7328 $2 $16 $11 $5435 $16.273 $9616 $11.153 $21.308 $6960 Net Income EBITDA $7215 $17.902 $12.937 $12.509 $11.822 $19.991 $16.981 EBIT E E E E E E E E E $8160 $6714 $5672 $13.722 $12.145 $11.824 5555 5569 5872 5970 6089 6176 Basic Shares Outstanding Shares Outstanding 5632 5675 5977 6159 6257 6058 $3.57 Basic EPS $1.73 $2.92 $1.90 $1.18 $1.13 EPS - Earnings Per Share $1.71 $2.87 $1.87 $3.52 $1.17 $1.11 Annual Data | Millions of US $ except per share data 2020-12-31 2019-12-31 2018-12-31 2017-12-31 2016-12-31 2015-12-31 Revenue $41.908 $41.172 $52.546 $52.824 $48.851 $40.825 $8987 Cost Of Goods Sold $8692 $8251 $12.322 $9648 $11.228 $41.318 Gross Profit EEEEE $33.216 $32.921 $31.838 $40.502 $39.203 $9405 $8394 $7760 $7683 $7892 $7690 $11.615 $12.750 $12.612 $14.804 $14.844 $14.809 Research And Development Expenses SG&A Expenses Other Operating Income Or Expenses Operating Expenses Operating Income Total Non-Operating Income/Expense Pre-Tax Income $33.748 $34.458 $35.153 $38.824 $40.679 $37.027 $8160 $6714 $5672 $13.722 $12.145 $11.824 $-663 $4772 $-2077 $-1416 $-3794 $-2860 E E E E E E $7497 $11.485 $3594 $12.305 $8351 $8965 Income Taxes $477 $618 $-266 $-9049 $1123 $1990 Income After Taxes $7020 $10.867 $3860 $21.354 $7228 $6975 Other Income $7021 $10.867 $3861 $21.353 $7229 $6975 Income From Continuous Operations Income From Discontinued Operations $2631 $7328 $2 $16 $11 $5435 $16.273 $9616 $11.153 $21.308 $6960 Net Income EBITDA $7215 $17.902 $12.937 $12.509 $11.822 $19.991 $16.981 EBIT E E E E E E E E E $8160 $6714 $5672 $13.722 $12.145 $11.824 5555 5569 5872 5970 6089 6176 Basic Shares Outstanding Shares Outstanding 5632 5675 5977 6159 6257 6058 $3.57 Basic EPS $1.73 $2.92 $1.90 $1.18 $1.13 EPS - Earnings Per Share $1.71 $2.87 $1.87 $3.52 $1.17 $1.11
Step by Step Solution
There are 3 Steps involved in it
Step: 1

Get Instant Access to Expert-Tailored Solutions
See step-by-step solutions with expert insights and AI powered tools for academic success
Step: 2

Step: 3

Ace Your Homework with AI
Get the answers you need in no time with our AI-driven, step-by-step assistance
Get Started


