Answered step by step
Verified Expert Solution
Question
1 Approved Answer
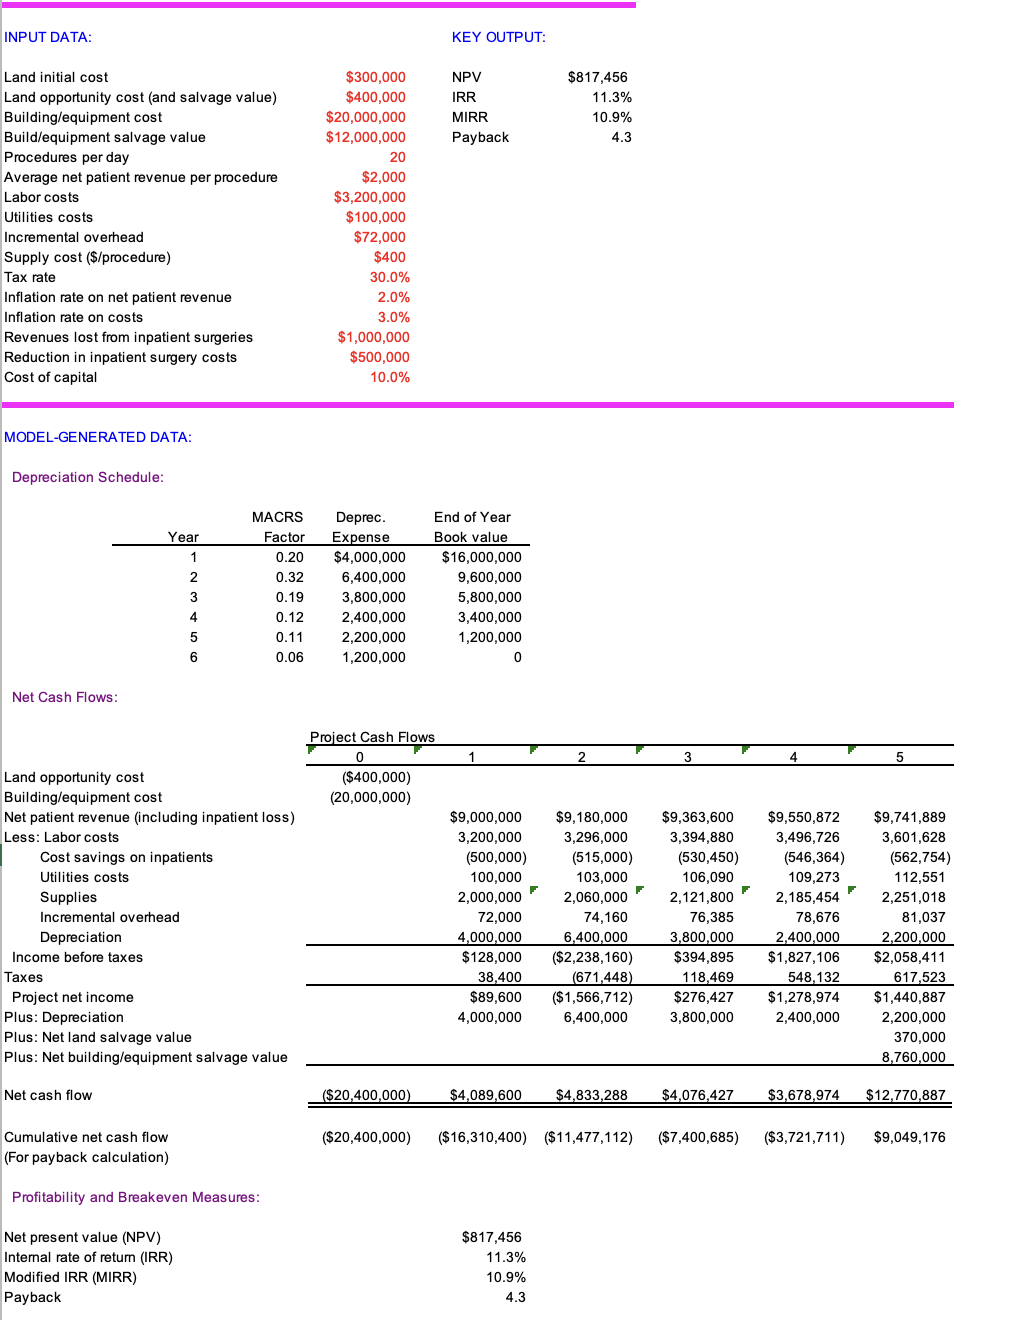
Perform a scenario analysis Using the data table below INPUT DATA: KEY OUTPUT: NPV IRR MIRR Payback $817,456 11.3% 10.9% 4.3 Land initial cost Land
Perform a scenario analysis Using the data table below

INPUT DATA: KEY OUTPUT: NPV IRR MIRR Payback $817,456 11.3% 10.9% 4.3 Land initial cost Land opportunity cost and salvage value) Building/equipment cost Build/equipment salvage value Procedures per day Average net patient revenue per procedure Labor costs Utilities costs Incremental overhead Supply cost ($/procedure) Tax rate Inflation rate on net patient revenue Inflation rate on costs Revenues lost from inpatient surgeries Reduction in inpatient surgery costs Cost of capital $300,000 $400,000 $20,000,000 $12,000,000 20 $2,000 $3,200,000 $100,000 $72,000 $400 30.0% 2.0% 3.0% $1,000,000 $500,000 10.0% MODEL-GENERATED DATA: Depreciation Schedule: Year 1 2 MACRS Factor 0.20 0.32 0.19 0.12 0.11 0.06 Deprec. Expense $4,000,000 6,400,000 3,800,000 2,400,000 2,200,000 1,200,000 End of Year Book value $16,000,000 9,600,000 5,800,000 3,400,000 1,200,000 0 3 4 5 6 Net Cash Flows: 1 2 3 4 5 Project Cash Flows 0 ($400,000) (20,000,000) Land opportunity cost Building/equipment cost Net patient revenue (including inpatient loss) Less: Labor costs Cost savings on inpatients Utilities costs Supplies Incremental overhead Depreciation Income before taxes Taxes Project net income Plus: Depreciation Plus: Net land salvage value Plus: Net building/equipment salvage value $9,000,000 3,200,000 (500,000) 100,000 2,000,000 72,000 4,000,000 $128,000 38,400 $89,600 4,000,000 $9,180,000 3,296,000 (515,000) 103,000 2,060,000 74,160 6,400,000 ($2,238,160) (671,448) ($1,566,712) 6,400,000 $9,363,600 3,394,880 (530,450) 106,090 2,121,800 76,385 3,800,000 $394,895 118,469 $276,427 3,800,000 $9,550,872 3,496,726 (546,364) 109,273 2,185,454 78,676 2,400,000 $1,827,106 548,132 $1,278,974 2,400,000 $9,741,889 3,601,628 (562,754) 112,551 2,251,018 81,037 2,200,000 $2,058,411 617,523 $1,440,887 2,200,000 370,000 8.760,000 Net cash flow ($20,400,000) $4,089,600 $4,833,288 $4,076,427 $3,678,974 $12,770,887 ($20,400,000) ($16,310,400) ($11,477,112) ($7,400,685) ($3,721,711) $9,049,176 Cumulative net cash flow (For payback calculation) Profitability and Breakeven Measures: Net present value (NPV) Internal rate of return (IRR) Modified IRR (MIRR) Payback $817,456 11.3% 10.9% 4.3 INPUT DATA: KEY OUTPUT: NPV IRR MIRR Payback $817,456 11.3% 10.9% 4.3 Land initial cost Land opportunity cost and salvage value) Building/equipment cost Build/equipment salvage value Procedures per day Average net patient revenue per procedure Labor costs Utilities costs Incremental overhead Supply cost ($/procedure) Tax rate Inflation rate on net patient revenue Inflation rate on costs Revenues lost from inpatient surgeries Reduction in inpatient surgery costs Cost of capital $300,000 $400,000 $20,000,000 $12,000,000 20 $2,000 $3,200,000 $100,000 $72,000 $400 30.0% 2.0% 3.0% $1,000,000 $500,000 10.0% MODEL-GENERATED DATA: Depreciation Schedule: Year 1 2 MACRS Factor 0.20 0.32 0.19 0.12 0.11 0.06 Deprec. Expense $4,000,000 6,400,000 3,800,000 2,400,000 2,200,000 1,200,000 End of Year Book value $16,000,000 9,600,000 5,800,000 3,400,000 1,200,000 0 3 4 5 6 Net Cash Flows: 1 2 3 4 5 Project Cash Flows 0 ($400,000) (20,000,000) Land opportunity cost Building/equipment cost Net patient revenue (including inpatient loss) Less: Labor costs Cost savings on inpatients Utilities costs Supplies Incremental overhead Depreciation Income before taxes Taxes Project net income Plus: Depreciation Plus: Net land salvage value Plus: Net building/equipment salvage value $9,000,000 3,200,000 (500,000) 100,000 2,000,000 72,000 4,000,000 $128,000 38,400 $89,600 4,000,000 $9,180,000 3,296,000 (515,000) 103,000 2,060,000 74,160 6,400,000 ($2,238,160) (671,448) ($1,566,712) 6,400,000 $9,363,600 3,394,880 (530,450) 106,090 2,121,800 76,385 3,800,000 $394,895 118,469 $276,427 3,800,000 $9,550,872 3,496,726 (546,364) 109,273 2,185,454 78,676 2,400,000 $1,827,106 548,132 $1,278,974 2,400,000 $9,741,889 3,601,628 (562,754) 112,551 2,251,018 81,037 2,200,000 $2,058,411 617,523 $1,440,887 2,200,000 370,000 8.760,000 Net cash flow ($20,400,000) $4,089,600 $4,833,288 $4,076,427 $3,678,974 $12,770,887 ($20,400,000) ($16,310,400) ($11,477,112) ($7,400,685) ($3,721,711) $9,049,176 Cumulative net cash flow (For payback calculation) Profitability and Breakeven Measures: Net present value (NPV) Internal rate of return (IRR) Modified IRR (MIRR) Payback $817,456 11.3% 10.9% 4.3
Step by Step Solution
There are 3 Steps involved in it
Step: 1

Get Instant Access to Expert-Tailored Solutions
See step-by-step solutions with expert insights and AI powered tools for academic success
Step: 2

Step: 3

Ace Your Homework with AI
Get the answers you need in no time with our AI-driven, step-by-step assistance
Get Started


