Answered step by step
Verified Expert Solution
Question
1 Approved Answer
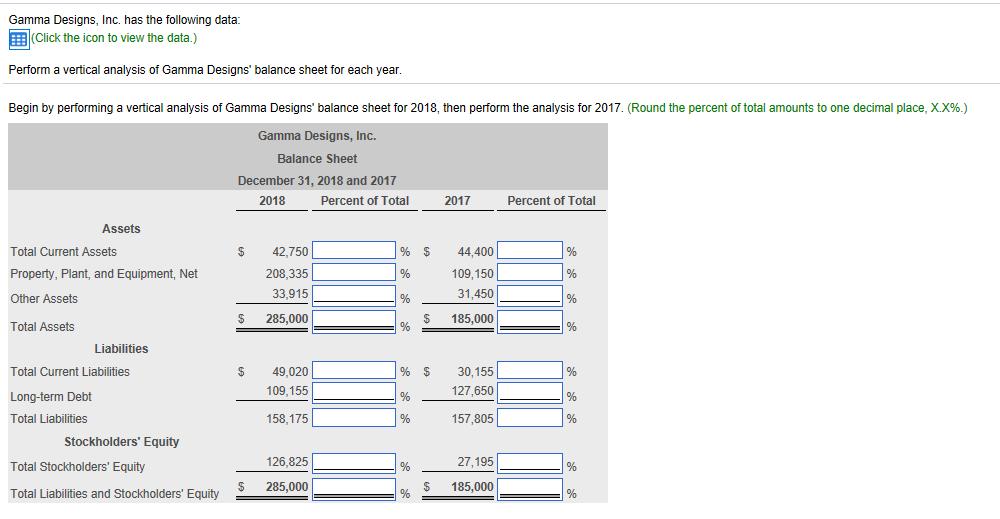
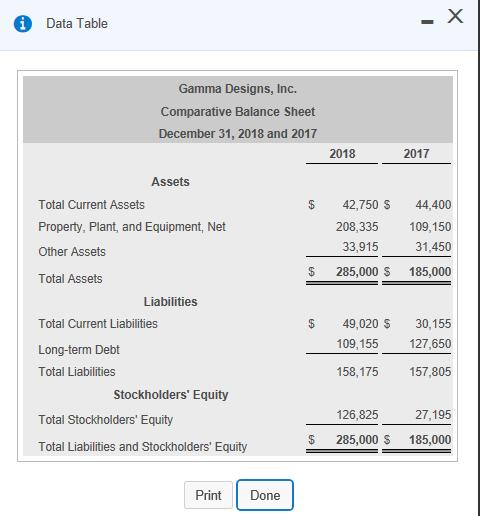
Perform a vertical analysis of Gamma Gamma Designs' balance sheet for each year. Gamma Designs, Inc. has the following data: (Click the icon to view
Perform a vertical analysis of Gamma Gamma Designs' balance sheet for each year.


Gamma Designs, Inc. has the following data: (Click the icon to view the data.) Perform a vertical analysis of Gamma Designs balance sheet for each year. Begin by performing a vertical analysis of Gamma Designs balance sheet for 2018, then perform the analysis for 2017. (Round the percent of total amounts to one decimal place, X.X%.) Gamma Designs, Inc. Balance Sheet December 31, 2018 and 2017 2018 Percent of Total Assets Total Current Assets Property, Plant, and Equipment, Net Other Assets Total Assets Long-term Debt Total Liabilities Liabilities Total Current Liabilities Stockholders Equity Total Stockholders Equity Total Liabilities and Stockholders Equity $ 42,750 208,335 33,915 $ 285,000 $ $ 49,020 109,155 158,175 126,825 285,000 % $ % % % % $ % % % $ % $ 2017 44,400 109,150 31,450 185,000 30,155 127,650 157,805 27,195 185,000 Percent of Total % % % % % % % % % Data Table Gamma Designs, Inc. Comparative Balance Sheet December 31, 2018 and 2017 Assets Total Current Assets Property, Plant, and Equipment, Net Other Assets Total Assets Liabilities Total Current Liabilities Long-term Debt Total Liabilities Stockholders Equity Total Stockholders Equity Total Liabilities and Stockholders Equity Print Done $ $ 2018 $ 44,400 208,335 109,150 33,915 31,450 $ 285,000 $ 185,000 42,750 S 49,020 $ 109,155 158,175 - 126,825 285,000 $ 2017 X 30,155 127,650 157,805 27,195 185,000
Step by Step Solution
★★★★★
3.43 Rating (166 Votes )
There are 3 Steps involved in it
Step: 1
Solution 2017 Percent of Total Assets Total Current Assets 15 24 44400 731 109150 59 Property Plant ...
Get Instant Access to Expert-Tailored Solutions
See step-by-step solutions with expert insights and AI powered tools for academic success
Step: 2

Step: 3

Ace Your Homework with AI
Get the answers you need in no time with our AI-driven, step-by-step assistance
Get Started


