

Question
Perform and interpret a one-way repeated-measures ANOVA. To see if the reading program leads to significant improvement on reading comprehension, the researchers want to compare
Perform and interpret a one-way repeated-measures ANOVA.
To see if the reading program leads to significant improvement on reading comprehension, the researchers want to compare the three test scores at the three grade levels. Perform a one-way repeated-measured ANOVA to answer the following question:
Is reading comprehension significantly different across the three grade levels?
A. What is the null hypothesis?
B. What are the DV and IV?
C. Run the ANOVA with the following options: Descriptives; Estimate of effect size (partial eta squared)
D. Examine the Sphericity test result. Is the sphericity assumption met? How do you know?
E. Report the test result in proper format (including F statistic, p-value,and partial ?2).
F. What is the answer to the research question based on the test result?
G. Run the same ANOVA again, but this time request "contrasts" to compare each level with every other level. Follow the steps below:
- Run the repeated-measures ANOVA, then request simple contrasts for the variable of "Grade", with "Last" level as the reference category. This will compare each level with the "last" level.Paste the table of "Tests of Within-Subjects Contrasts" below
- Run the repeated-measures ANOVA, then request simple contrasts for the variable of "Grade", with "First" level as the reference category. This will compare each level with the "first" level.Paste the table of "Tests of Within-Subjects Contrasts" below
- Report the result of each of the pair-wise contrasts, including F statistics (with df's) and p value, in proper format.
- Determine whether there is a significantdifference in reading comprehension in each contrast.
- List all the pairs that have significantdifferences in reading comprehension.
References:
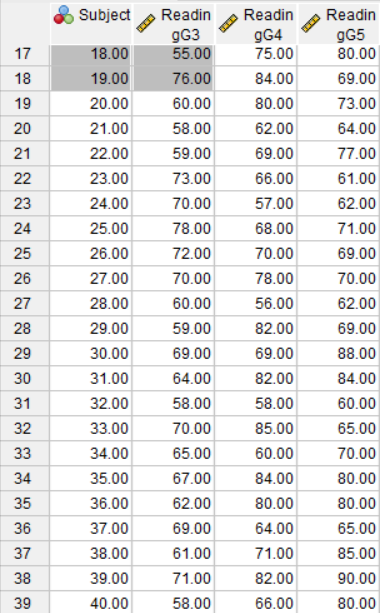
This data set contains reading comprehension scores from a group of elementary school children who were in a special reading program. These children were tested when they entered the reading program at third grade, and then tested again at fourth grade, and finally tested as they leave the program at fifth grade. Ensure that your data values, labels, and measures are correct before proceeding.

Step by Step Solution
There are 3 Steps involved in it
Step: 1

Get Instant Access to Expert-Tailored Solutions
See step-by-step solutions with expert insights and AI powered tools for academic success
Step: 2

Step: 3
Ace Your Homework with AI
Get the answers you need in no time with our AI-driven, step-by-step assistance
Get Started
Linear Algebra and Its Applications
Authors: Gilbert Strang
4th edition
30105678, 30105676, 978-0030105678