Answered step by step
Verified Expert Solution
Question
1 Approved Answer
Perform Industry and competitive analysis. Atlantic Corporation-Abridged On April 10, 1984, Patrick Halloran and Steven Winters, chairman of Atlantic Corporation al Paper Corporation, respectively, met

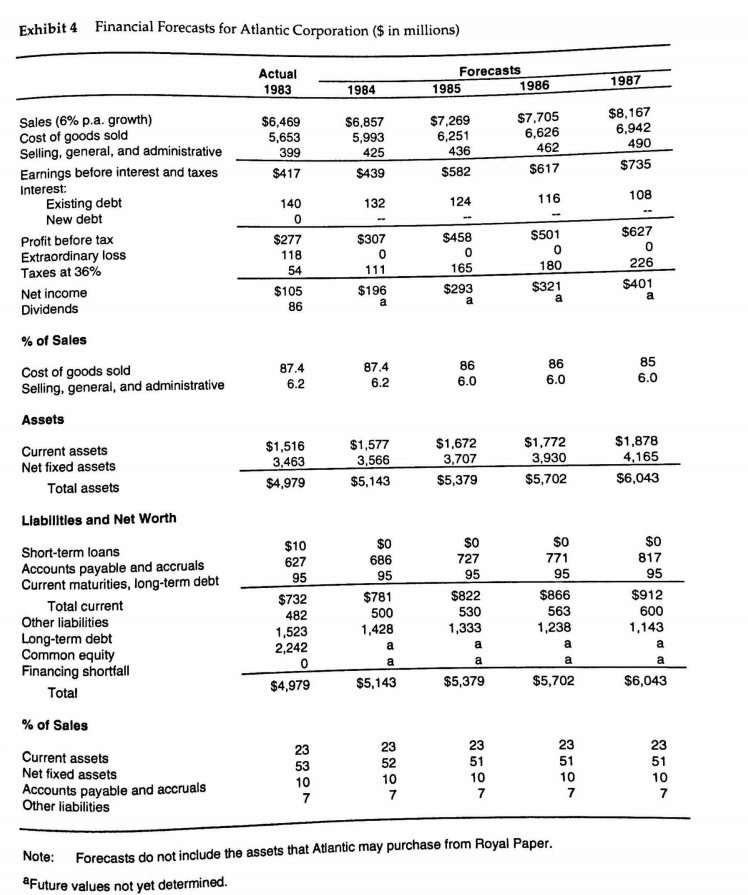
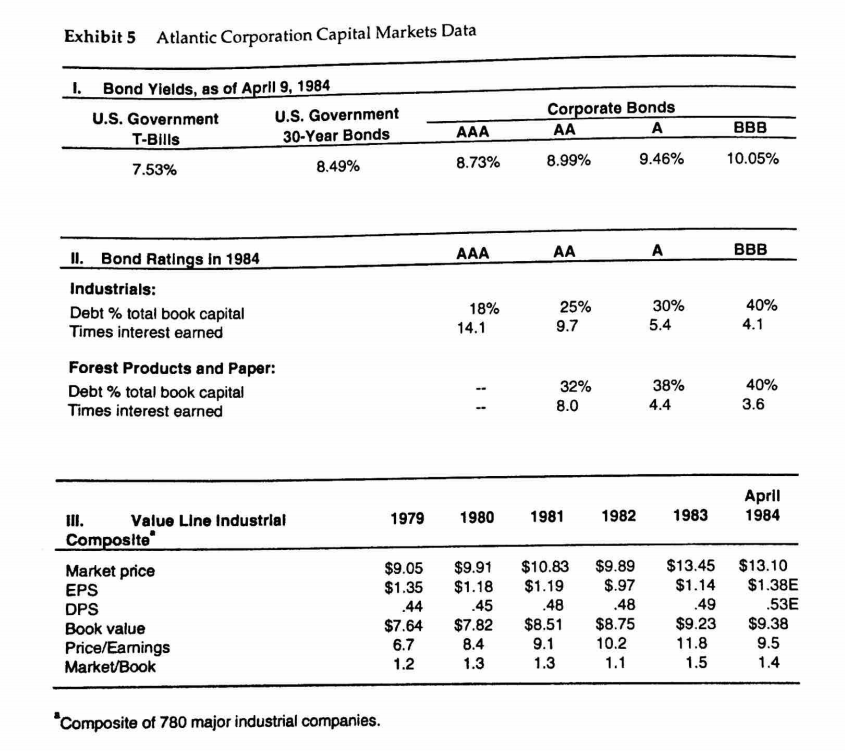
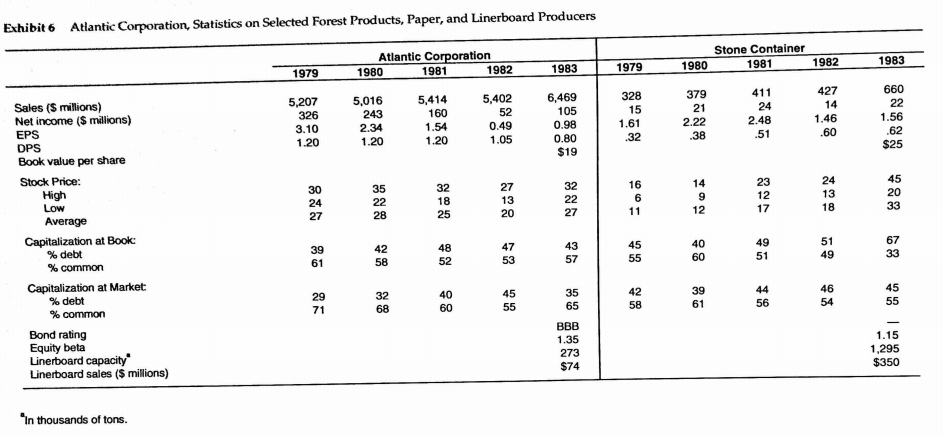
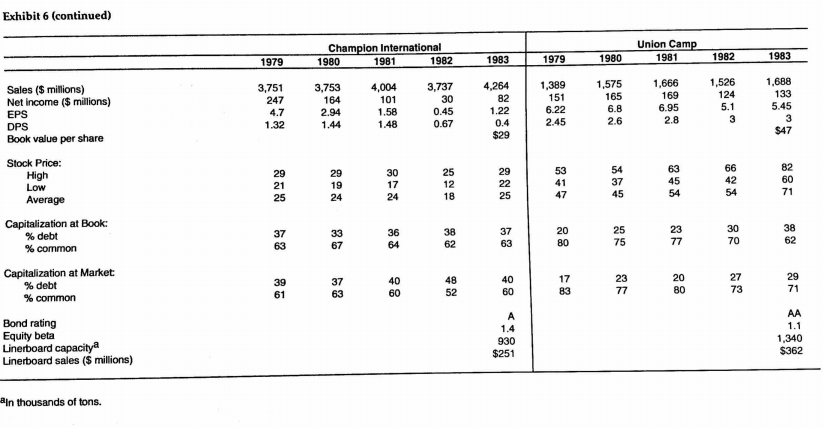
Perform Industry and competitive analysis.
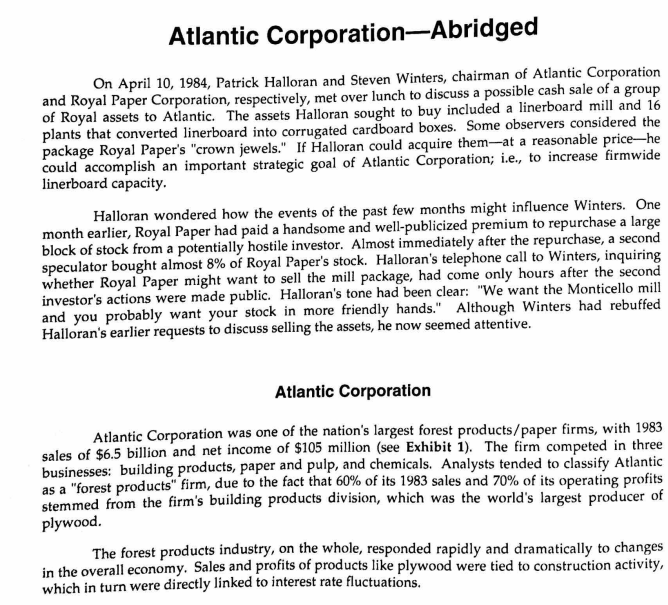
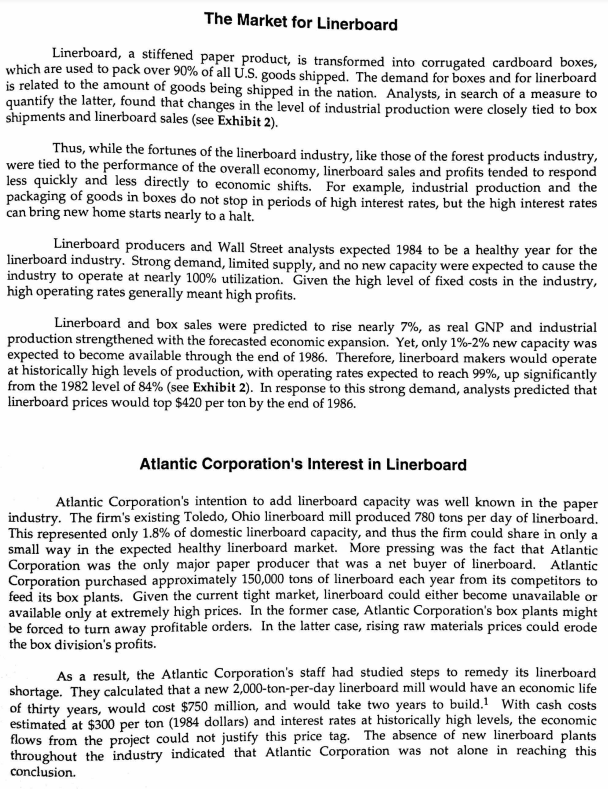
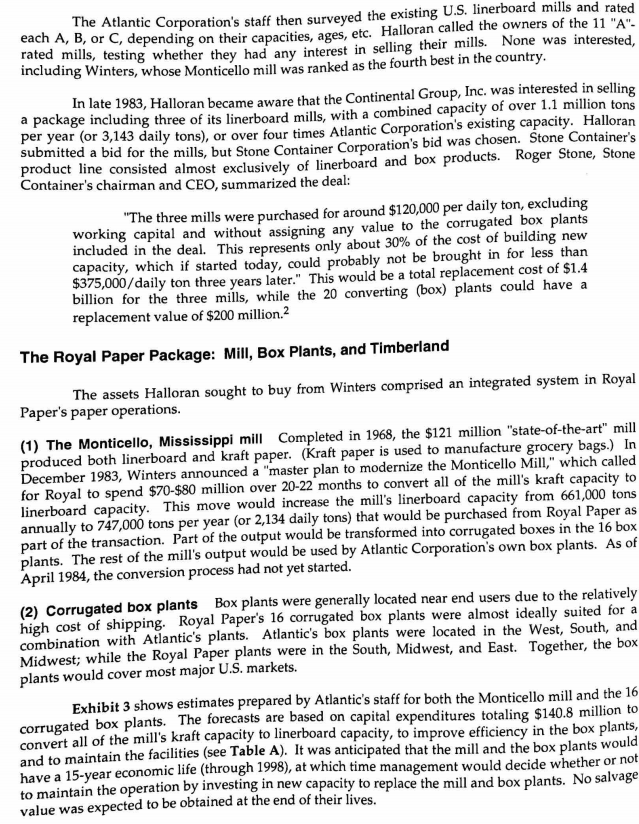
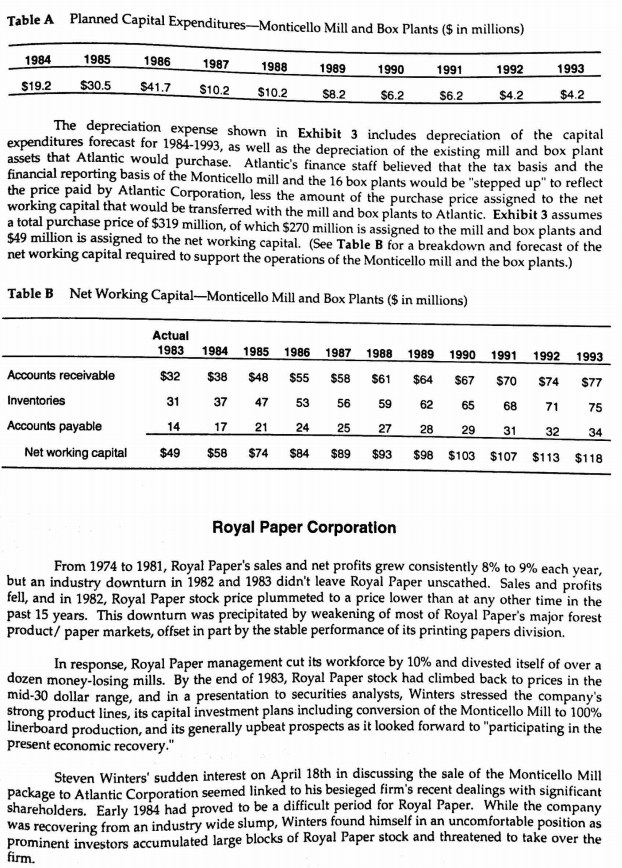
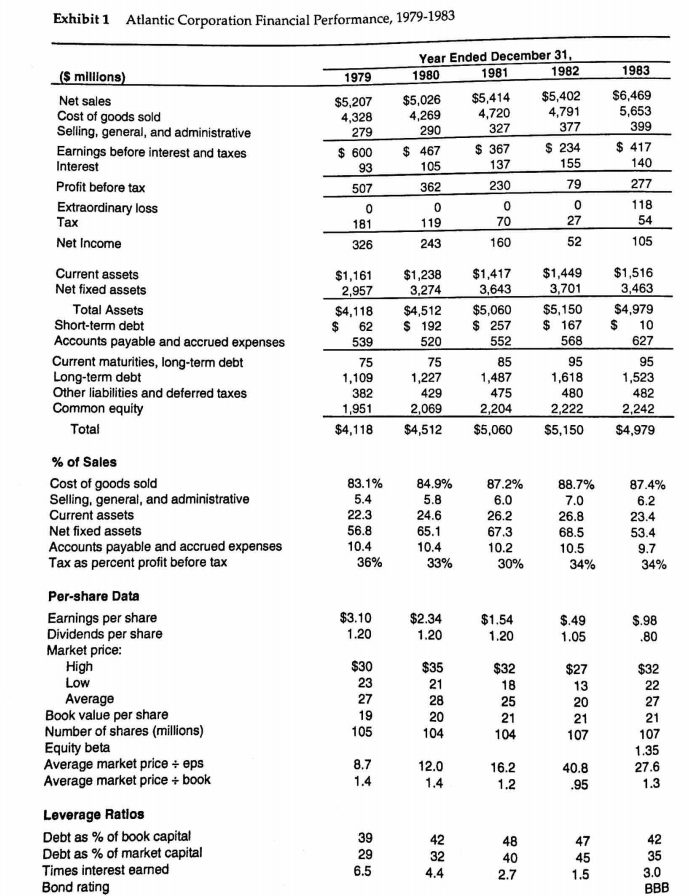
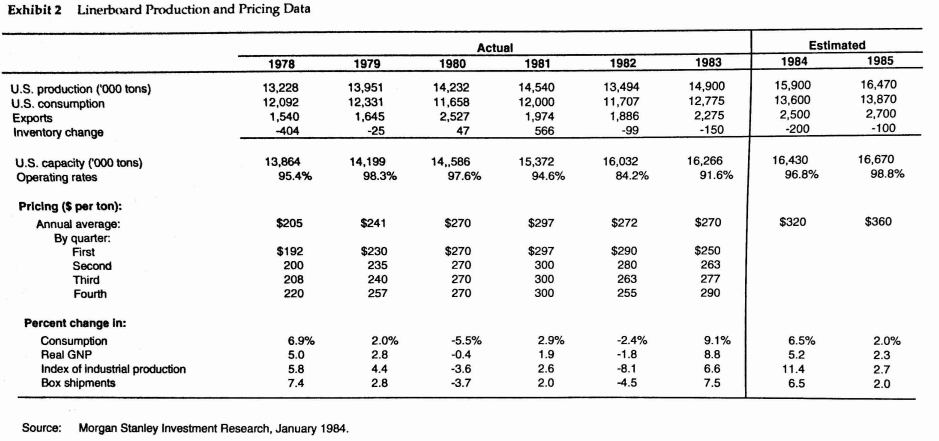
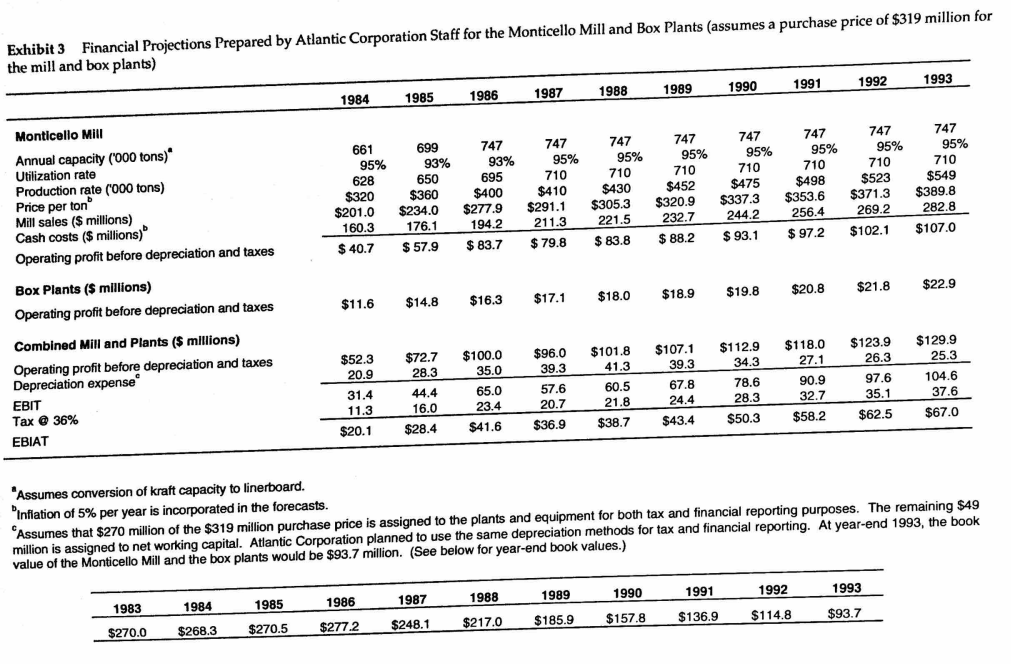
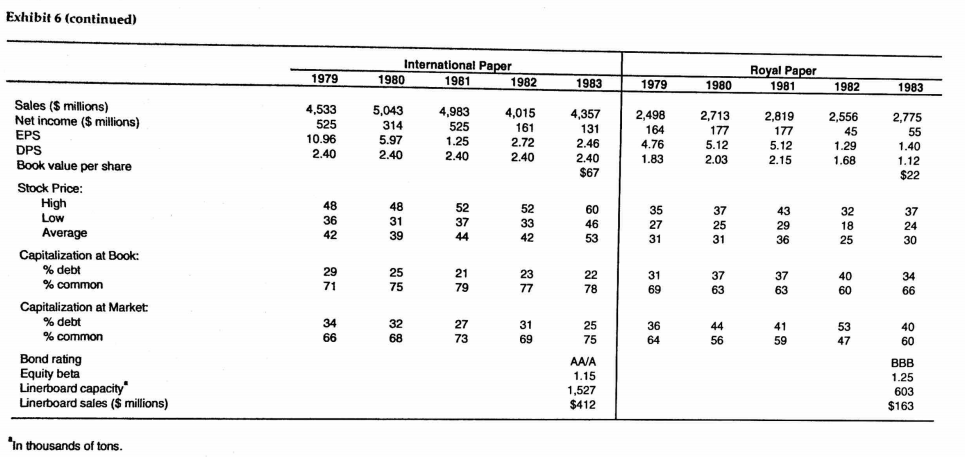
Atlantic Corporation-Abridged On April 10, 1984, Patrick Halloran and Steven Winters, chairman of Atlantic Corporation al Paper Corporation, respectively, met over lunch to discuss a possible cash sale of a group yal assets to Atlantic. The assets Halloran sought to buy included a linerboard mill and 16 and Roy of Ro plants that converted linerboard into corrugated cardboard boxes. Some observers considered the package Royal Paper's "crown jewels." If Halloran could acquire them-at a reasonable price-he mplish an important strategic goal of Atlantic Corporation; .e., to increase firmwide linerboard capacity Halloran wondered how the events of the past few months might influence Winters. One month earlier, Royal Paper had paid a handsome and well-publicized premium to repurchase a large block of stock from a potentially hostile investor. Almost immediately after the repurcha speculator bought almost 8% of Royal Paper's stock. Halloran's telephone call to Winters, inquiring whether Royal Paper mig investor's actions were made public. Halloran's tone had been clear: "We wa and you probably want your stock in more friendly hands." Although Winters had rebuffecd Halloran's earlier requests to discuss selling the assets, he now seemed attentive sell the mill package, had come only hours after the second want to Atlantic Corporation Atlantic Corporation was one of the nation's largest forest products/paper firms, with 1983 $105 million (see Exhibit 1). The firm competed in three building products, paper and pulp, and chemicals. Analysts tended to classify Atlantic sales of $6.5 billion and net income of businesses: "forest products" firm, due to the fact that 60% of its 1983 sales and 70% of its operating profits as a stemmed from the firm's building products division, which was the world's largest producer of plywood The forest products industry, on the whole, responded rapidly and dramatically to changes in the overall economy. Sales and profits of products like plywood were tied to construction activity, which in turn were directly linked to i nterest rate fluctuations. The Market for Linerboard Linerboard, a stiffened paper product, is transformed into corrugated cardboard boxes, all U.S. goods shipped. The demand for boxes and for linerboard a measure to which are used to pack over 90% of goods ship is related to the amount of goods being shipped in the nation. Analysts, in searc quantify the latter, found that changes in the level of industrial production were closely ti shipments and linerboard sales (see Exhibit 2). h of hus, while the fortunes of the linerboard industry, like those of the forest products industry. were tied to the performance of the overall economy, linerboard sales and profits tended to respond less quickly and less directly to economic shifts. For example, industrial production and the packaging of goods in boxes do not stop in periods of high interest rates, but the high interest rates can bring new home starts nearly to a halt. Linerboard producers and Wall Street analysts expected 1984 to be a healthy year for the linerboard industry. Strong demand, limited supply, and no new capacity were expected to cause the industry to operate at nearly 100% utilization. Given the high level of fixed costs in the industry, high operating rates generally meant high profits. Linerboard and box sales were predicted to rise nearly 7%, as real GNP and industrial production strengthened with the forecasted economic expansion. Yet, only 1%-2% new capacity was expected to become available through the end of 1986. Therefore, linerboard makers would operate at historically high levels of production, with operating rates expected to reach 99%, up significantly from the 1982 level of 84% (see Exhibit 2). In response to this strong demand, analysts predicted that linerboard prices would top $420 per ton by the end of 1986. Atlantic Corporation's Interest in Linerboard Atlantic Corporation's intention to add linerboard capacity was well known in the paper industry. The firm's existing Toledo, Ohio linerboard mill produced 780 tons per day of linerboard. This represented only 1.8% of domestic linerboard capacity, and thus the firm could share in only a small way in the expected healthy linerboard market. More pressing was the fact that Atlantic Corporation was the only major paper producer that was a net buyer of linerboard. Atlantic Corporation purchased approximately 150,000 tons of linerboard each year from its competitors to feed its box plants. Given the current tight market, linerboard could either become unavailable or available only at extremely high prices. In the former case, Atlantic Corporation's box plants might be forced to turn away profitable orders. In the latter case, rising raw materials prices could erode the box division's profits. As a result, the Atlantic Corporation's staff had studied steps to remedy its linerboard shortage. They calculated that a new 2,000-ton-per-day linerboard mill would have an economic life of thirty years, would cost $750 million, and would take two years to build.1 With cash costs estimated at $300 per ton (1984 dollars) and interest rates at historically high levels, the economic flows from the project could not justify this price tag. The absence of new linerboard plants throughout the industry indicated that Atlantic Corporation was not alone in reaching this conclusion. Planned Capital Expenditures-Monticello Mill a Table A nd Box Plants ($in millions) 1985 1986 1984 1987 1988 1990 $6.2 pense shown in Exhibit 3 includes depreciation of the capital purchase. Atlantic's finance staff believed that the tax basis and the 1989 1993 1991 1992 $19.2 $30.5 $41.7 S10.2 S10.2 S8.2 $4.2 S6.2 $4.2 The depreciation ex ditures forecast for 1984-1993, as well as the depreciation of the existing mill an assets that Atlantic would financial reporting basis of the Monticello mill and the 16 box plants would be "stepped up" to refl the price paid by Atlantic Corporation, less the amount of the purchase price assi working capital that would be transferred with the mill and box plants to Atlantic. Exhibit 3 ect tal purchase price of $319 million, of which $270 million is assigned to the mill and box pla a to $49 million net working capital required to support the operations of the Monticello mill and the box plants.) is assigned to the net working capital. (See Table B for a breakdown and forecast of the Table B Net Working Capital-Monticello Mill and Box Plants (S in millions) Actual 1983 1984 1985 1986 1987 1988 1989 1990 1991 1992 1993 $32 $38 S48 $55 58 $61 $64 S67 $70 $74 $77 75 34 Net working capital $49 $58 $74 84 8993 9 $103 $107 $113 $118 Accounts receivable Inventories Accounts payable 37 47 53 56 59 6265 68 71 31 17 2124 25 2728 29 31 14 32 Royal Paper Corporation From 1974 to 1981, Royal Paper's sales and net profits grew consistently 8% to 9% each year but an industry downturn in 1982 and 1983 didn't leave Royal Paper unscathed. Sales and profits fell, and in 1982, Royal Paper stock price plummeted to a price lower than at any other time in the past 15 years. This downturn was precipitated by weakening of most of Royal Paper's major forest product/ paper markets, offset in part by the stable performance of its printing papers division. In response, Royal Paper management cut its workforce by 10% and divested itself of over a dozen money-losing mills. By the end of 1983, Royal Paper stock had climbed back to prices in the mid-30 dollar range, and in a presentation to securities analysts, Winters stressed the company's strong product lines, its capital investment plans including conversion of the Monticello Mill to 100% linerboard production, and its generally upbeat prospects as it looked forward to participating in the present economic recovery Steven Winters' sudden interest on April 18th in discussing the sale of the Monticello Mill package to Atlantic Corporation seemed linked to his besieged firm's recent dealings with significant shareholders. Early 1984 had proved to be a difficult period for Royal Paper. While the companv industry wide slump, Winters found himself in an uncomfortable position as was recovering from an prominent investors accumulated large blocks of Royal Paper stock and threatened to take over the firm. Exhibi1 Atlantic Corporation Financial Performance, 1979-1983 Year Ended December 31 1981 1982 1983 S millions Net sales Cost of goods sold Selling, general, and administrative Earnings before interest and taxes Interest Profit before tax 1980 1979 $5,207 $5,026 $5,414 $5,402 $6,469 5,653 4,791 377 4,720 4,328 279 399 327 290 467 362 367 234 417 137 s 600 140 155 79 277 230 Extraordinary loss 27 105 Net Income 52 326 $1,161 $1,238 $1,417$1,449 $1,516 3,463 Current assets Net fixed assets 3,701 3,274 3,643 2,957 $4,118 $4,512 $5,060 $5,150 $4,979 $ 62 192 257 167 10 627 95 1,523 Total Assets Short-term debt Accounts payable and accrued expenses 520 75 1,227 429 2,069 552 539 568 Current maturities, long-term debt Long-term debt Other liabilities and deferred taxes Common equity 1,487 475 2,204 1,618 2,242 $4,118 $4,512 $5,060 $5,150 $4,979 1,951 2,222 Total % of Sales 83.1% Cost of goods sold Selling, general, and administrative Current assets Net fixed assets Accounts payable and accrued expenses Tax as percent profit before tax 84.9% 872% 88.7% 87.4% 26.2 67.3 10.2 26.8 68.5 10.5 23.4 56.8 36% 34% 34% Per-share Data $3.10 1.20 Earnings per share Dividends per share Market price: $2.34 $1.54 $32 $32 Average Book value per share Number of shares (millions) Equity beta Average market price+ eps Average market price + book 21 107 1.35 27.6 16.2 Leverage Ratios Debt as % of book capital Debt as % of market capital Times interest earned Bond rating 47 35 Atlantic Corporation-Abridged On April 10, 1984, Patrick Halloran and Steven Winters, chairman of Atlantic Corporation al Paper Corporation, respectively, met over lunch to discuss a possible cash sale of a group yal assets to Atlantic. The assets Halloran sought to buy included a linerboard mill and 16 and Roy of Ro plants that converted linerboard into corrugated cardboard boxes. Some observers considered the package Royal Paper's "crown jewels." If Halloran could acquire them-at a reasonable price-he mplish an important strategic goal of Atlantic Corporation; .e., to increase firmwide linerboard capacity Halloran wondered how the events of the past few months might influence Winters. One month earlier, Royal Paper had paid a handsome and well-publicized premium to repurchase a large block of stock from a potentially hostile investor. Almost immediately after the repurcha speculator bought almost 8% of Royal Paper's stock. Halloran's telephone call to Winters, inquiring whether Royal Paper mig investor's actions were made public. Halloran's tone had been clear: "We wa and you probably want your stock in more friendly hands." Although Winters had rebuffecd Halloran's earlier requests to discuss selling the assets, he now seemed attentive sell the mill package, had come only hours after the second want to Atlantic Corporation Atlantic Corporation was one of the nation's largest forest products/paper firms, with 1983 $105 million (see Exhibit 1). The firm competed in three building products, paper and pulp, and chemicals. Analysts tended to classify Atlantic sales of $6.5 billion and net income of businesses: "forest products" firm, due to the fact that 60% of its 1983 sales and 70% of its operating profits as a stemmed from the firm's building products division, which was the world's largest producer of plywood The forest products industry, on the whole, responded rapidly and dramatically to changes in the overall economy. Sales and profits of products like plywood were tied to construction activity, which in turn were directly linked to i nterest rate fluctuations. The Market for Linerboard Linerboard, a stiffened paper product, is transformed into corrugated cardboard boxes, all U.S. goods shipped. The demand for boxes and for linerboard a measure to which are used to pack over 90% of goods ship is related to the amount of goods being shipped in the nation. Analysts, in searc quantify the latter, found that changes in the level of industrial production were closely ti shipments and linerboard sales (see Exhibit 2). h of hus, while the fortunes of the linerboard industry, like those of the forest products industry. were tied to the performance of the overall economy, linerboard sales and profits tended to respond less quickly and less directly to economic shifts. For example, industrial production and the packaging of goods in boxes do not stop in periods of high interest rates, but the high interest rates can bring new home starts nearly to a halt. Linerboard producers and Wall Street analysts expected 1984 to be a healthy year for the linerboard industry. Strong demand, limited supply, and no new capacity were expected to cause the industry to operate at nearly 100% utilization. Given the high level of fixed costs in the industry, high operating rates generally meant high profits. Linerboard and box sales were predicted to rise nearly 7%, as real GNP and industrial production strengthened with the forecasted economic expansion. Yet, only 1%-2% new capacity was expected to become available through the end of 1986. Therefore, linerboard makers would operate at historically high levels of production, with operating rates expected to reach 99%, up significantly from the 1982 level of 84% (see Exhibit 2). In response to this strong demand, analysts predicted that linerboard prices would top $420 per ton by the end of 1986. Atlantic Corporation's Interest in Linerboard Atlantic Corporation's intention to add linerboard capacity was well known in the paper industry. The firm's existing Toledo, Ohio linerboard mill produced 780 tons per day of linerboard. This represented only 1.8% of domestic linerboard capacity, and thus the firm could share in only a small way in the expected healthy linerboard market. More pressing was the fact that Atlantic Corporation was the only major paper producer that was a net buyer of linerboard. Atlantic Corporation purchased approximately 150,000 tons of linerboard each year from its competitors to feed its box plants. Given the current tight market, linerboard could either become unavailable or available only at extremely high prices. In the former case, Atlantic Corporation's box plants might be forced to turn away profitable orders. In the latter case, rising raw materials prices could erode the box division's profits. As a result, the Atlantic Corporation's staff had studied steps to remedy its linerboard shortage. They calculated that a new 2,000-ton-per-day linerboard mill would have an economic life of thirty years, would cost $750 million, and would take two years to build.1 With cash costs estimated at $300 per ton (1984 dollars) and interest rates at historically high levels, the economic flows from the project could not justify this price tag. The absence of new linerboard plants throughout the industry indicated that Atlantic Corporation was not alone in reaching this conclusion. Planned Capital Expenditures-Monticello Mill a Table A nd Box Plants ($in millions) 1985 1986 1984 1987 1988 1990 $6.2 pense shown in Exhibit 3 includes depreciation of the capital purchase. Atlantic's finance staff believed that the tax basis and the 1989 1993 1991 1992 $19.2 $30.5 $41.7 S10.2 S10.2 S8.2 $4.2 S6.2 $4.2 The depreciation ex ditures forecast for 1984-1993, as well as the depreciation of the existing mill an assets that Atlantic would financial reporting basis of the Monticello mill and the 16 box plants would be "stepped up" to refl the price paid by Atlantic Corporation, less the amount of the purchase price assi working capital that would be transferred with the mill and box plants to Atlantic. Exhibit 3 ect tal purchase price of $319 million, of which $270 million is assigned to the mill and box pla a to $49 million net working capital required to support the operations of the Monticello mill and the box plants.) is assigned to the net working capital. (See Table B for a breakdown and forecast of the Table B Net Working Capital-Monticello Mill and Box Plants (S in millions) Actual 1983 1984 1985 1986 1987 1988 1989 1990 1991 1992 1993 $32 $38 S48 $55 58 $61 $64 S67 $70 $74 $77 75 34 Net working capital $49 $58 $74 84 8993 9 $103 $107 $113 $118 Accounts receivable Inventories Accounts payable 37 47 53 56 59 6265 68 71 31 17 2124 25 2728 29 31 14 32 Royal Paper Corporation From 1974 to 1981, Royal Paper's sales and net profits grew consistently 8% to 9% each year but an industry downturn in 1982 and 1983 didn't leave Royal Paper unscathed. Sales and profits fell, and in 1982, Royal Paper stock price plummeted to a price lower than at any other time in the past 15 years. This downturn was precipitated by weakening of most of Royal Paper's major forest product/ paper markets, offset in part by the stable performance of its printing papers division. In response, Royal Paper management cut its workforce by 10% and divested itself of over a dozen money-losing mills. By the end of 1983, Royal Paper stock had climbed back to prices in the mid-30 dollar range, and in a presentation to securities analysts, Winters stressed the company's strong product lines, its capital investment plans including conversion of the Monticello Mill to 100% linerboard production, and its generally upbeat prospects as it looked forward to participating in the present economic recovery Steven Winters' sudden interest on April 18th in discussing the sale of the Monticello Mill package to Atlantic Corporation seemed linked to his besieged firm's recent dealings with significant shareholders. Early 1984 had proved to be a difficult period for Royal Paper. While the companv industry wide slump, Winters found himself in an uncomfortable position as was recovering from an prominent investors accumulated large blocks of Royal Paper stock and threatened to take over the firm. Exhibi1 Atlantic Corporation Financial Performance, 1979-1983 Year Ended December 31 1981 1982 1983 S millions Net sales Cost of goods sold Selling, general, and administrative Earnings before interest and taxes Interest Profit before tax 1980 1979 $5,207 $5,026 $5,414 $5,402 $6,469 5,653 4,791 377 4,720 4,328 279 399 327 290 467 362 367 234 417 137 s 600 140 155 79 277 230 Extraordinary loss 27 105 Net Income 52 326 $1,161 $1,238 $1,417$1,449 $1,516 3,463 Current assets Net fixed assets 3,701 3,274 3,643 2,957 $4,118 $4,512 $5,060 $5,150 $4,979 $ 62 192 257 167 10 627 95 1,523 Total Assets Short-term debt Accounts payable and accrued expenses 520 75 1,227 429 2,069 552 539 568 Current maturities, long-term debt Long-term debt Other liabilities and deferred taxes Common equity 1,487 475 2,204 1,618 2,242 $4,118 $4,512 $5,060 $5,150 $4,979 1,951 2,222 Total % of Sales 83.1% Cost of goods sold Selling, general, and administrative Current assets Net fixed assets Accounts payable and accrued expenses Tax as percent profit before tax 84.9% 872% 88.7% 87.4% 26.2 67.3 10.2 26.8 68.5 10.5 23.4 56.8 36% 34% 34% Per-share Data $3.10 1.20 Earnings per share Dividends per share Market price: $2.34 $1.54 $32 $32 Average Book value per share Number of shares (millions) Equity beta Average market price+ eps Average market price + book 21 107 1.35 27.6 16.2 Leverage Ratios Debt as % of book capital Debt as % of market capital Times interest earned Bond rating 47 35Step by Step Solution
There are 3 Steps involved in it
Step: 1

Get Instant Access to Expert-Tailored Solutions
See step-by-step solutions with expert insights and AI powered tools for academic success
Step: 2

Step: 3

Ace Your Homework with AI
Get the answers you need in no time with our AI-driven, step-by-step assistance
Get Started


