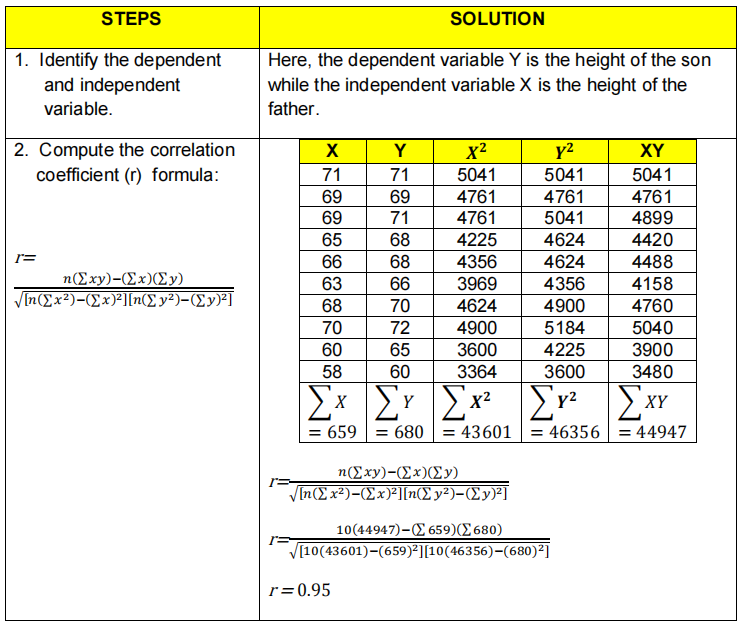
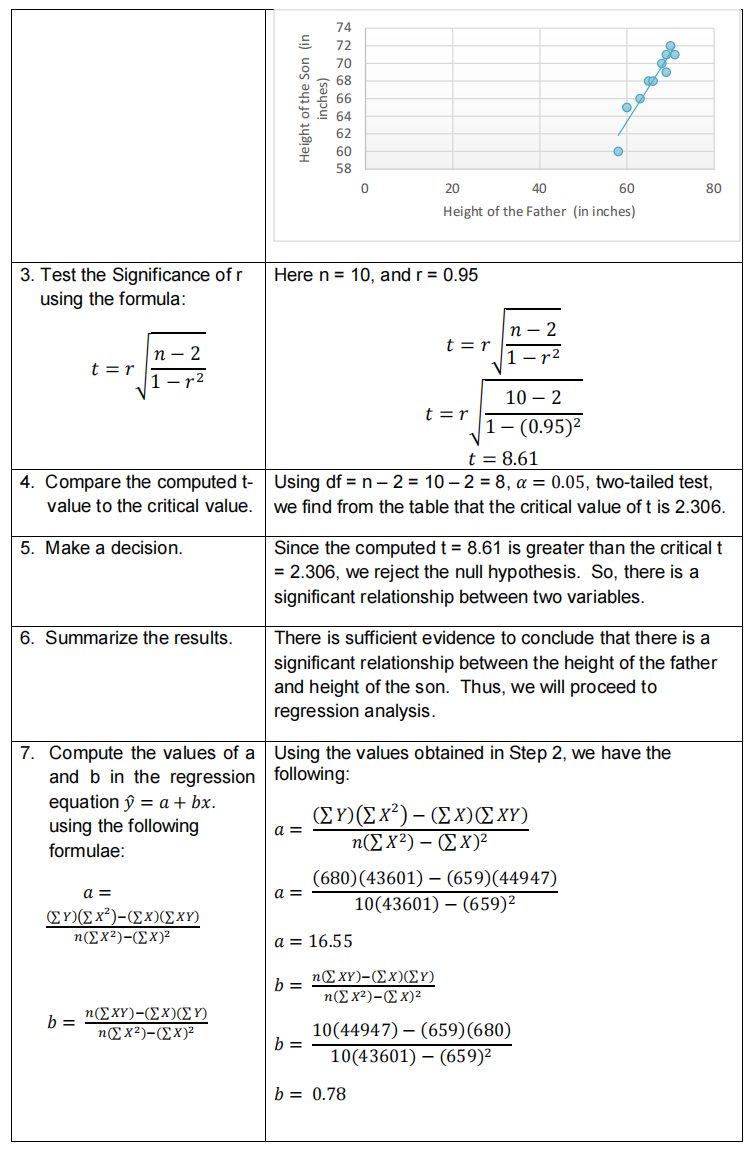

PERFORMANCE TASK (SINGLE OUTPUT) LEARNING COMPETENCY: The learners solve problems involving regression analysis. PERFORMANCE STANDARD: The learner is able to perform correlation and regression analyses on real-life problems in different disciplines. SITUATION: The Minerale Cosmetics Company where you are working is conducting a program that aims to improve the company's response to consumers' demands. You are requested to gather information from 2017-2018 in your file regarding your company's product demand and sales. The gathered data are as follows: Period Product Demand Sales (in thousands) (in thousands) January 2017 16.5 3 005 February 2017 13.0 2 340 March 2017 14.2 2 450 April 2017 17.3 5 905 May 2017 20.0 6 050 June 2017 11.6 2 020 July 2017 11.4 2 045 August 2017 18.7 5 555 September 2017 17.5 6 090 October 2017 16.5 5 670 November 2017 15.9 5 400 December 2017 14.2 3 400 January 2018 13.6 2 350 February 2019 21.0 3 560 March 2018 14.5 4 200 April 2018 15.0 4 400 May 2018 15.9 5 950 June 2018 16.8 6 500 July 2018 17.1 7 050 August 2018 20.3 8 505 September 2018 12.8 3 500 October 2018 14.5 3 800 November 2018 16.5 4 100 December 2018 18.9 5 650 GOAL: Your goal is to provide data analysis to the Top Management regarding the causal relationship between sales and demand of the product your company is selling.ROLE: You are a statistician who will conduct simple regression analysis in determining a model that can predict future sales values given the company's demand. PRODUCT: You are expected to prepare a statistical report using the following: a} Present the scatterplot and the regression line. b} Compute for the value of r. c} Test the significance of r. d} Present the correct regression model. AUDIENCE: The result of the statistical report will be presented to the Bank manager. STANDARDS: Your output will be evaluated based on the following: Accuracy computation of statistical tools, accuracv of the regression model, clarity.r of presentation, and content of the written presentation- STEPS SOLUTION 1. Identify the dependent Here, the dependent variable Y is the height of the son and independent while the independent variable X is the height of the variable. father. 2. Compute the correlation X Y X2 XY coefficient (r) formula: 71 71 5041 5041 5041 69 69 4761 4761 4761 69 71 4761 5041 4899 65 68 4225 4624 4420 66 68 4356 4624 4488 n(Exy)-(x)(Zy) 63 56 3969 4356 4158 [n(Ex2)-(Ex)=][n(Zy2)-(Zy)2] 68 70 4624 4900 4760 70 72 4900 5184 5040 60 65 3600 4225 3900 58 60 3364 3600 3480 [xz [XY = 659 = 680 = 43601 = 46356 = 44947 n(Exy)-(Ex)(Zy) In(E x2)-(Ex)"][n(Zy2)-(Zy)=] 10(44947)-(2 659)(2680) [10(43601)-(659)2][10(46356)-(680)2] r =0.95inches) Height of the Son (in O 0 20 40 60 80 Height of the Father (in inches) 3. Test the Significance of r Here n = 10, and r = 0.95 using the formula: n - 2 t=r t = 10 - 2 t=r 1 - (0.95)2 t = 8.61 4. Compare the computed t- Using df = n - 2 = 10 -2 = 8, a = 0.05, two-tailed test, value to the critical value. we find from the table that the critical value of t is 2.306. 5. Make a decision. Since the computed t = 8.61 is greater than the critical t = 2.306, we reject the null hypothesis. So, there is a significant relationship between two variables. 6. Summarize the results. There is sufficient evidence to conclude that there is a significant relationship between the height of the father and height of the son. Thus, we will proceed to regression analysis. 7. Compute the values of a Using the values obtained in Step 2, we have the and b in the regression following: equation y = a + bx. using the following a = (En (EX2 ) - (EX) ([XY) formulae: n(EX2) - (Ex)2 (680) (43601) - (659)(44947) a = a = ED(EX)-(EX)(EXY) 10(43601) - (659)2 n(EX2)-(Ex)2 a = 16.55 b = n(EXY)- (EX) (LY) n(E x2)-(EX)2 b = n(EXY )- (EX)(EY) n(X X2)-(EX)2 10(44947) - (659) (680) b = 10(43601) - (659)2 b = 0.788. Form the regression Substitute the values of a and b in the equation equation. D = a+ bx D = 16.55 + 0.78x The regression equation for predicting the height of the son given the height of the father is = 16.55 + 0.78x 9. Predict the height of the Find the value of Y when X = 78 in the regression son if the height of the equation. father is 78 inches. 9 = 16.55 + 0.78x D = 16.55 + 0.78(78) 9 = 77.39 or 77 inches So, the predicted height of the son whose father's height is 78 inches is 77 inches. Remember that this is just a predicted value based on the given data


