

Answered step by step
Verified Expert Solution
Question
1 Approved Answer
Pete has measured the diameter and circumference of four different tires, listed the data in a table, and graphed the results on a scatterplot.
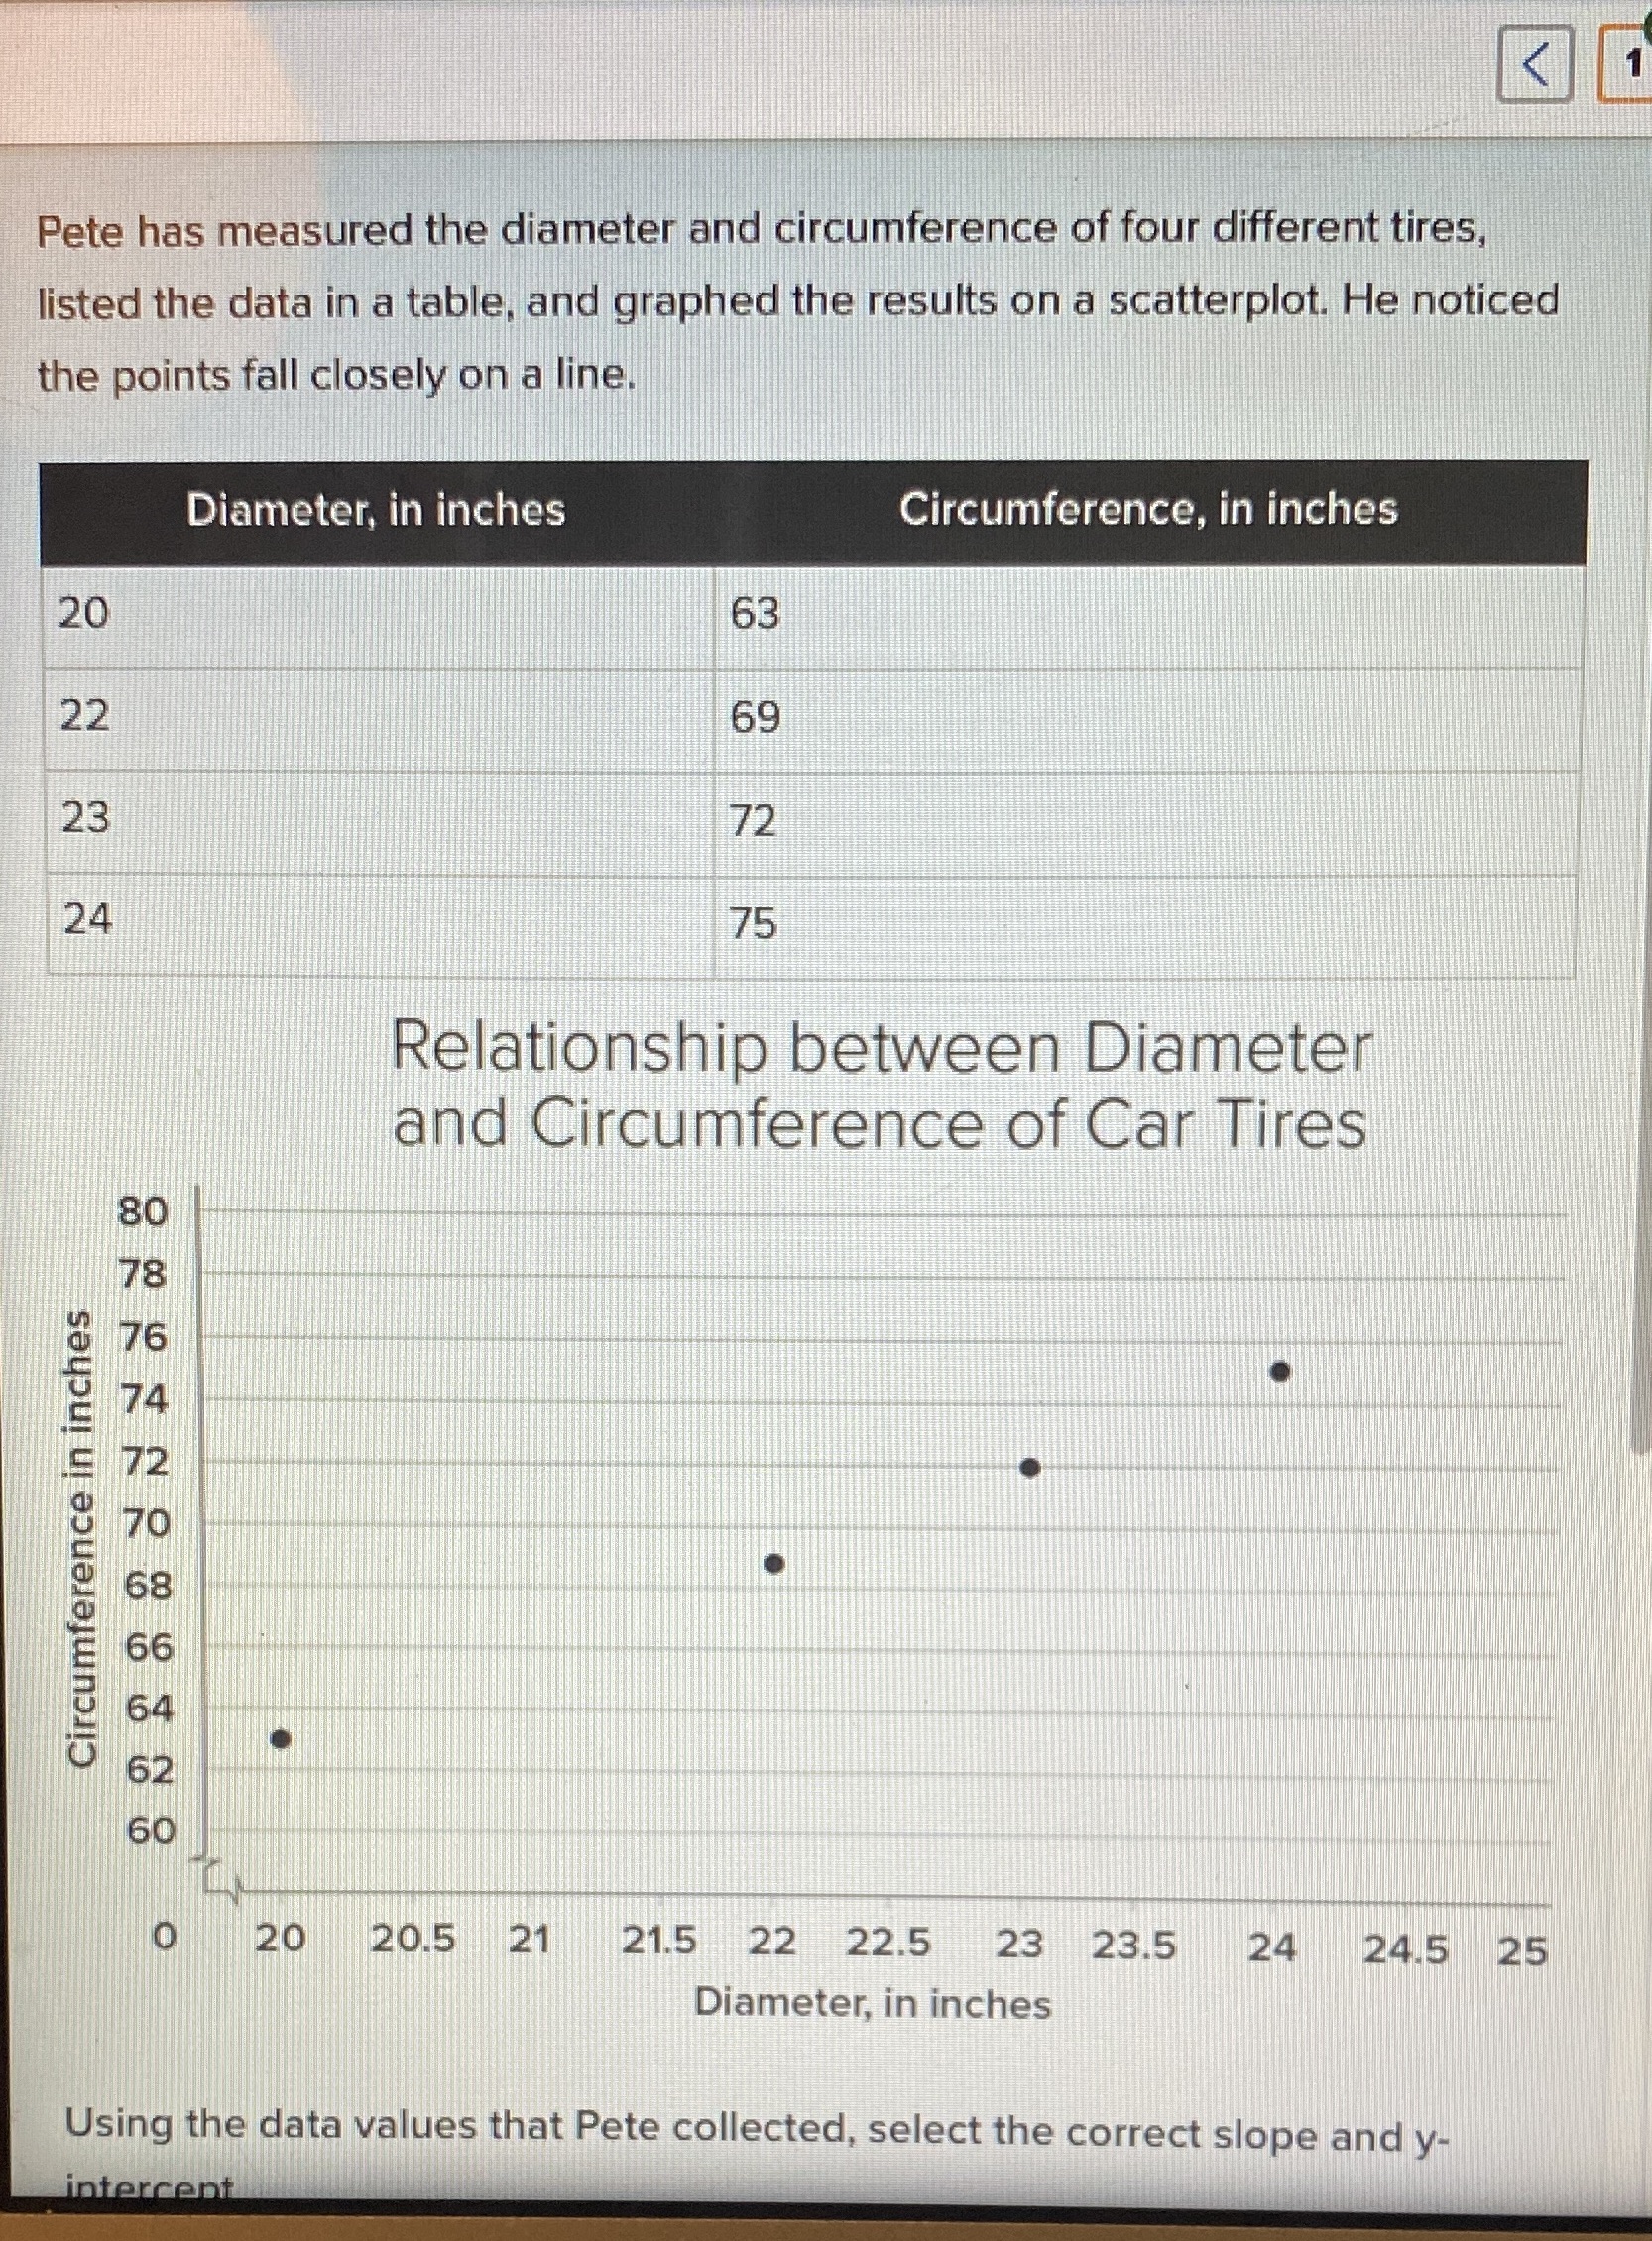

Pete has measured the diameter and circumference of four different tires, listed the data in a table, and graphed the results on a scatterplot. He noticed the points fall closely on a line. Diameter, in inches 20 20 22 23 24 80 78 Circumference in inches 66 64 62 60 NOOTNO 76 74 72 70 68 Circumference, in inches 63 69 72 75 Relationship between Diameter and Circumference of Car Tires 20 20.5 21 21.5 22 22.5 23 23.5 24 Diameter, in inches 24.5 25 Using the data values that Pete collected, select the correct slope and y- intercent
Step by Step Solution
There are 3 Steps involved in it
Step: 1

Get Instant Access to Expert-Tailored Solutions
See step-by-step solutions with expert insights and AI powered tools for academic success
Step: 2

Step: 3
Ace Your Homework with AI
Get the answers you need in no time with our AI-driven, step-by-step assistance
Get Started
Algebra (subscription)
Authors: Elayn Martin Gay
5th Edition
0134179137, 9780134179131