

Answered step by step
Verified Expert Solution
Question
1 Approved Answer
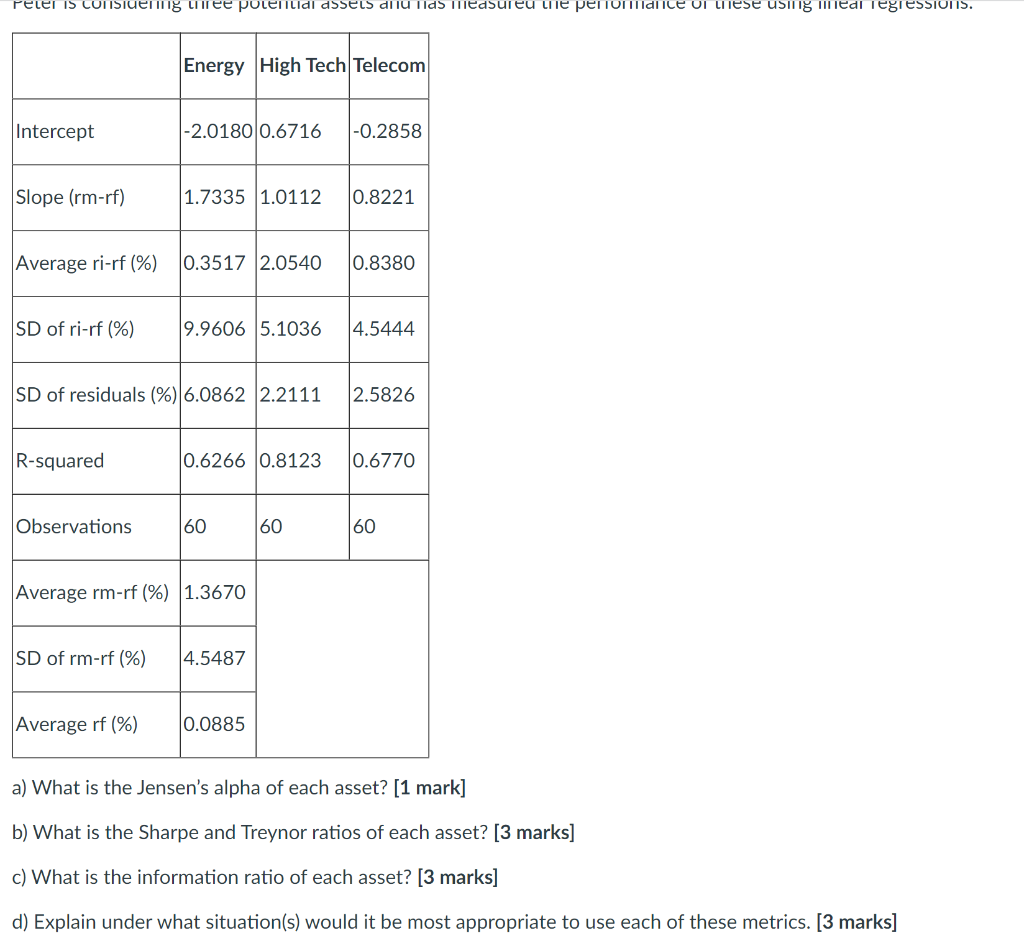
Peter is considering three potential assets and has measured the performance of these using linear regressions. Energy High Tech Telecom Intercept -2.0180 0.6716 -0.2858 Slope
Step by Step Solution
There are 3 Steps involved in it
Step: 1

Get Instant Access to Expert-Tailored Solutions
See step-by-step solutions with expert insights and AI powered tools for academic success
Step: 2

Step: 3
Ace Your Homework with AI
Get the answers you need in no time with our AI-driven, step-by-step assistance
Get Started
Big Tech In Finance
Authors: Igor Pejic
1st Edition
139860898X, 978-1398608986