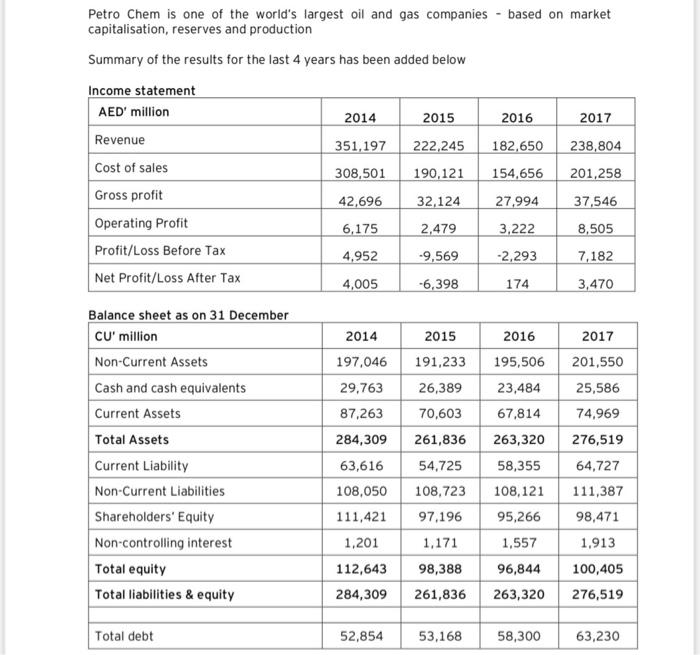
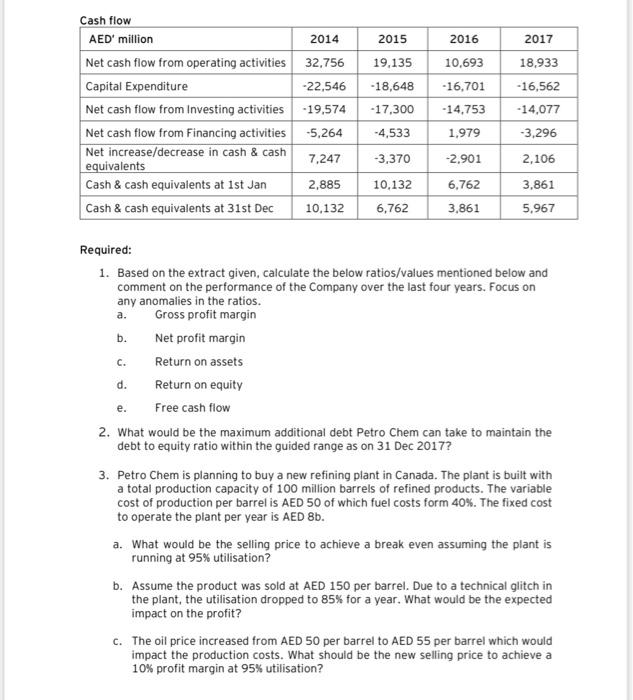
Petro Chem is one of the world's largest oil and gas companies - based on market capitalisation, reserves and production Summary of the results for the last 4 years has been added below Income statement AED' million 2014 2015 2016 2017 Revenue 351,197 222,245 182,650 238,804 Cost of sales 308,501 190,121 154,656 201,258 Gross profit 42,696 32,124 27.994 37,546 Operating Profit 6,175 2,479 3,222 8,505 Profit/Loss Before Tax 4,952 -9,569 -2,293 7,182 Net Profit/Loss After Tax 4,005 -6,398 174 3,470 Balance sheet as on 31 December CU' million 2014 2015 2016 2017 Non-Current Assets 197,046 191,233 195,506 201.550 Cash and cash equivalents 29,763 26,389 23,484 25,586 Current Assets 87,263 70,603 67,814 74,969 Total Assets 284,309 261,836 263,320 276,519 Current Liability 63,616 54,725 58,355 64,727 Non-Current Liabilities 108,050 108,723 108,121 111,387 Shareholders' Equity 111,421 97.196 95,266 98,471 Non-controlling interest 1,201 1,171 1,557 1,913 Total equity 112,643 98,388 96,844 100,405 Total liabilities & equity 284,309 261,836 263,320 276,519 Total debt 52,854 53,168 58,300 63,230 2014 2015 2016 Cash flow AED' million Net cash flow from operating activities 32.756 Capital Expenditure -22,546 Net cash flow from Investing activities -19,574 Net cash flow from Financing activities -5,264 Net increase/decrease in cash & cash 7,247 equivalents Cash & cash equivalents at 1st Jan 2,885 Cash & cash equivalents at 31st Dec 10,132 19,135 -18,648 -17,300 -4,533 10,693 -16,701 -14,753 1,979 2017 18,933 -16,562 -14,077 -3,296 -2.901 -3,370 10,132 6,762 6,762 3,861 2,106 3,861 5.967 a. C. e. Required: 1. Based on the extract given, calculate the below ratios/values mentioned below and comment on the performance of the Company over the last four years. Focus on any anomalies in the ratios. Gross profit margin b. Net profit margin Return on assets d. Return on equity Free cash flow 2. What would be the maximum additional debt Petro Chem can take to maintain the debt to equity ratio within the guided range as on 31 Dec 2017? 3. Petro Chem is planning to buy a new refining plant in Canada. The plant is built with a total production capacity of 100 million barrels of refined products. The variable cost of production per barrel is AED 50 of which fuel costs form 40%. The fixed cost to operate the plant per year is AED 8b. a. What would be the selling price to achieve a break even assuming the plant is running at 95% utilisation? b. Assume the product was sold at AED 150 per barrel. Due to a technical glitch in the plant, the utilisation dropped to 85% for a year. What would be the expected impact on the profit? C. The oil price increased from AED 50 per barrel to AED 55 per barrel which would impact the production costs. What should be the new selling price to achieve a 10% profit margin at 95% utilisation? Petro Chem is one of the world's largest oil and gas companies - based on market capitalisation, reserves and production Summary of the results for the last 4 years has been added below Income statement AED' million 2014 2015 2016 2017 Revenue 351,197 222,245 182,650 238,804 Cost of sales 308,501 190,121 154,656 201,258 Gross profit 42,696 32,124 27.994 37,546 Operating Profit 6,175 2,479 3,222 8,505 Profit/Loss Before Tax 4,952 -9,569 -2,293 7,182 Net Profit/Loss After Tax 4,005 -6,398 174 3,470 Balance sheet as on 31 December CU' million 2014 2015 2016 2017 Non-Current Assets 197,046 191,233 195,506 201.550 Cash and cash equivalents 29,763 26,389 23,484 25,586 Current Assets 87,263 70,603 67,814 74,969 Total Assets 284,309 261,836 263,320 276,519 Current Liability 63,616 54,725 58,355 64,727 Non-Current Liabilities 108,050 108,723 108,121 111,387 Shareholders' Equity 111,421 97.196 95,266 98,471 Non-controlling interest 1,201 1,171 1,557 1,913 Total equity 112,643 98,388 96,844 100,405 Total liabilities & equity 284,309 261,836 263,320 276,519 Total debt 52,854 53,168 58,300 63,230 2014 2015 2016 Cash flow AED' million Net cash flow from operating activities 32.756 Capital Expenditure -22,546 Net cash flow from Investing activities -19,574 Net cash flow from Financing activities -5,264 Net increase/decrease in cash & cash 7,247 equivalents Cash & cash equivalents at 1st Jan 2,885 Cash & cash equivalents at 31st Dec 10,132 19,135 -18,648 -17,300 -4,533 10,693 -16,701 -14,753 1,979 2017 18,933 -16,562 -14,077 -3,296 -2.901 -3,370 10,132 6,762 6,762 3,861 2,106 3,861 5.967 a. C. e. Required: 1. Based on the extract given, calculate the below ratios/values mentioned below and comment on the performance of the Company over the last four years. Focus on any anomalies in the ratios. Gross profit margin b. Net profit margin Return on assets d. Return on equity Free cash flow 2. What would be the maximum additional debt Petro Chem can take to maintain the debt to equity ratio within the guided range as on 31 Dec 2017? 3. Petro Chem is planning to buy a new refining plant in Canada. The plant is built with a total production capacity of 100 million barrels of refined products. The variable cost of production per barrel is AED 50 of which fuel costs form 40%. The fixed cost to operate the plant per year is AED 8b. a. What would be the selling price to achieve a break even assuming the plant is running at 95% utilisation? b. Assume the product was sold at AED 150 per barrel. Due to a technical glitch in the plant, the utilisation dropped to 85% for a year. What would be the expected impact on the profit? C. The oil price increased from AED 50 per barrel to AED 55 per barrel which would impact the production costs. What should be the new selling price to achieve a 10% profit margin at 95% utilisation