Question
Pfizer was founded in 1894 by Charles Pfizer and Charles Erhart. By the 1950s, Pfizer was established in Belgium, Brazil, Canada, Cuba, Iran, Mexico, Panama,
Pfizer was founded in 1894 by Charles Pfizer and Charles Erhart. By the 1950s, Pfizer was established in Belgium, Brazil, Canada, Cuba, Iran, Mexico, Panama, Puerto Rico, Turkey, and the United Kingdom. The company is headquartered in New York. The stock is listed in NYSE, LSE, Euronext, and Swiss exchanges. During the 1980s and 1990s, Pfizer underwent a period of growth sustained by the discovery and marketing of Zoloft, Lipitor, Norvasc, Zithromax, Aricept, Diflucan, and Viagra. Pfizer has recently grown by mergers, including those with WarnerLambert (2000), with Pharmacia (2003), and with Wyeth (2009). Pfizer had the greatest number of blockbuster products in 2009 with 14, which includes 5 inherited through the acquisition of Wyeth. The majority of Pfizer revenues come from the manufacture and sale of biopharmaceutical products. In 2015, Pfizer entered into a definitive agreement to acquire Hospira Inc., the world’s leading provider of injectable drugs and infusion technologies and a global leader in biosimilars, for $90 per share in cash, for a total enterprise value of approximately $17 billion.
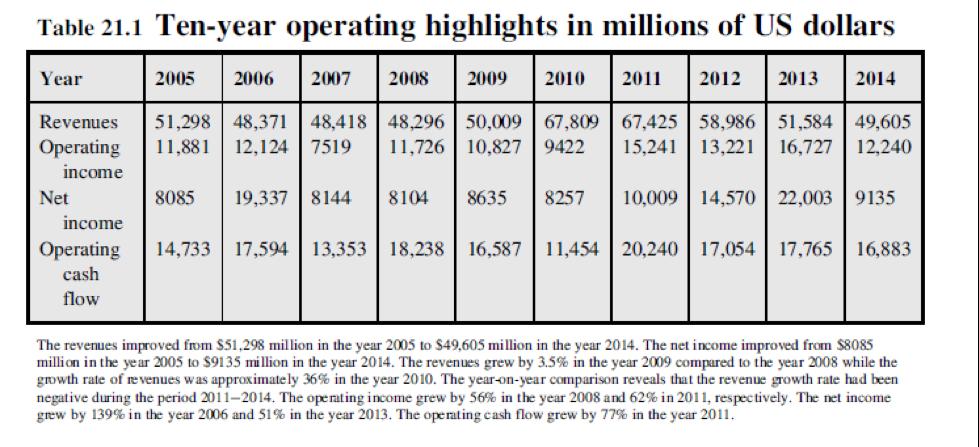
Revenues in 2014 were $49.6 billion, which represented a decrease of 4% compared to 2013. The Research & Development (R&D) expenses went up by $1.7 billion. The income from continuing operations in 2014 was $9.1 billion, compared to $11.4 billion in 2013.
The process of valuing a company usually involves five steps:
- Step 1: Identify and screen potential target candidates thoroughly to ensure that the proposed transaction is appropriate from a strategic standpoint
- Step 2: Analyze the historical performance of the target to ensure that this is an appropriate partner from a financial standpoint as well as to gain a thorough understanding of the targets business model, operations and capital structure
- Step 3: Forecast the future performance of the target by preparing pro forma statements (Income Statement, Balance Sheet & Cash Flow Statement)
- Step 4: Apply one or several valuation methods to get an estimate or estimates of the target’s value
- Step 5: Assess the sensitivity of the key pro forma and valuations assumptions on the target’s value
Steps 1, 2 & 3 have been already realized by analysts. Here are the main findings:
Step 2: Financial performance analysis
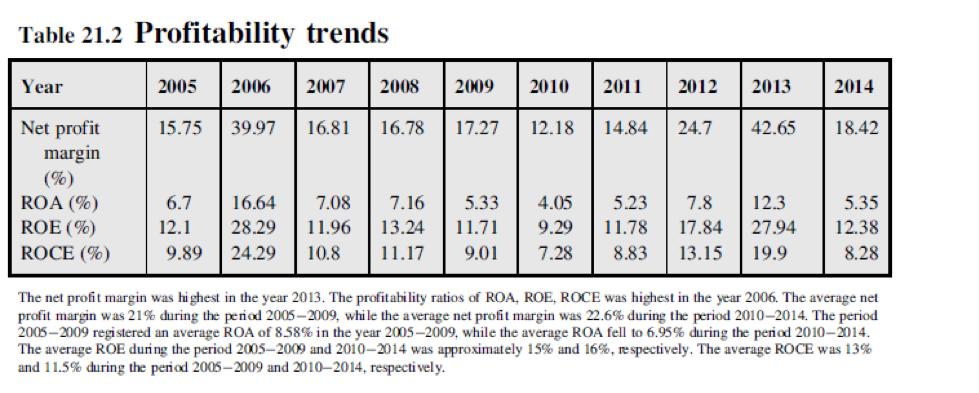
The data for analysis were obtained from Morningstar.com and the Annual Reports of Pfizer. Table 21.2 highlights the profitability ratios of Pfizer during the period 2005-2014.

Table 21.1 provides the financial highlights of Pfizer during the period 2005-2014.The average growth rate of revenues during the period 20062014 was 20.37%. The average net income growth rate was 1.36% during the 9-year period 2006-2014. The average growth rate of revenues during the period 2006-2009 was 3%, while the average growth rate of revenues during the period 20102014 was 20.16%. The average growth rate of operating income during the 4-year period was 22.29%, while the average growth rate of operating income during the 5-year period from 20102014 was 2.48%. The average growth rate of net income was 1.66% during the period 20062009, while the net income registered an average growth rate of 1.13% during the period 20102014. The operating cash flow grew by 3% on an average basis during the period 20062009, while the average growth rate was only 0.35% during the period 20102014.

Step 4: Apply one or several valuation methods to get an estimate or estimates of the target’s value
In step 4, analysts have already estimated the cost of equity and WACC. The cost of equity is estimated using the CAPM:
Cost of Equity = Risk free rate + Beta * Risk Premium
Beta is estimated by regressing the weekly returns of Pfizer on market index DJIA returns during the 5-year period 20102014.
Beta = 0.45
The average return on market index based on a 5-year period=11.68%
The risk-free rate is based on the average monthly yield of the 10-year treasury bond rate during the period 20122014.
Risk-free rate = 2.18%
Risk premium = 11.68 - 2.18 = 9.5%
Cost of equity = 2.18+0.45*9.5 = 6.46%
The cost of debt is assumed as the yield to maturity on a long-term bond of Pfizer maturing in the year 2038. The yield to maturity is estimated as 5.19%.
Corporate tax rate = 35%
After-tax cost of debt = 5.19 * (1-0.35) = 3.37%
The weights used for estimation of the cost of capital are the market value weights of equity and book value weight of debt.
Market value of equity in 2014 = 200,107.6 million
Book value of debt in 2014 = 36,682 million
Total value = 236,789.6 million
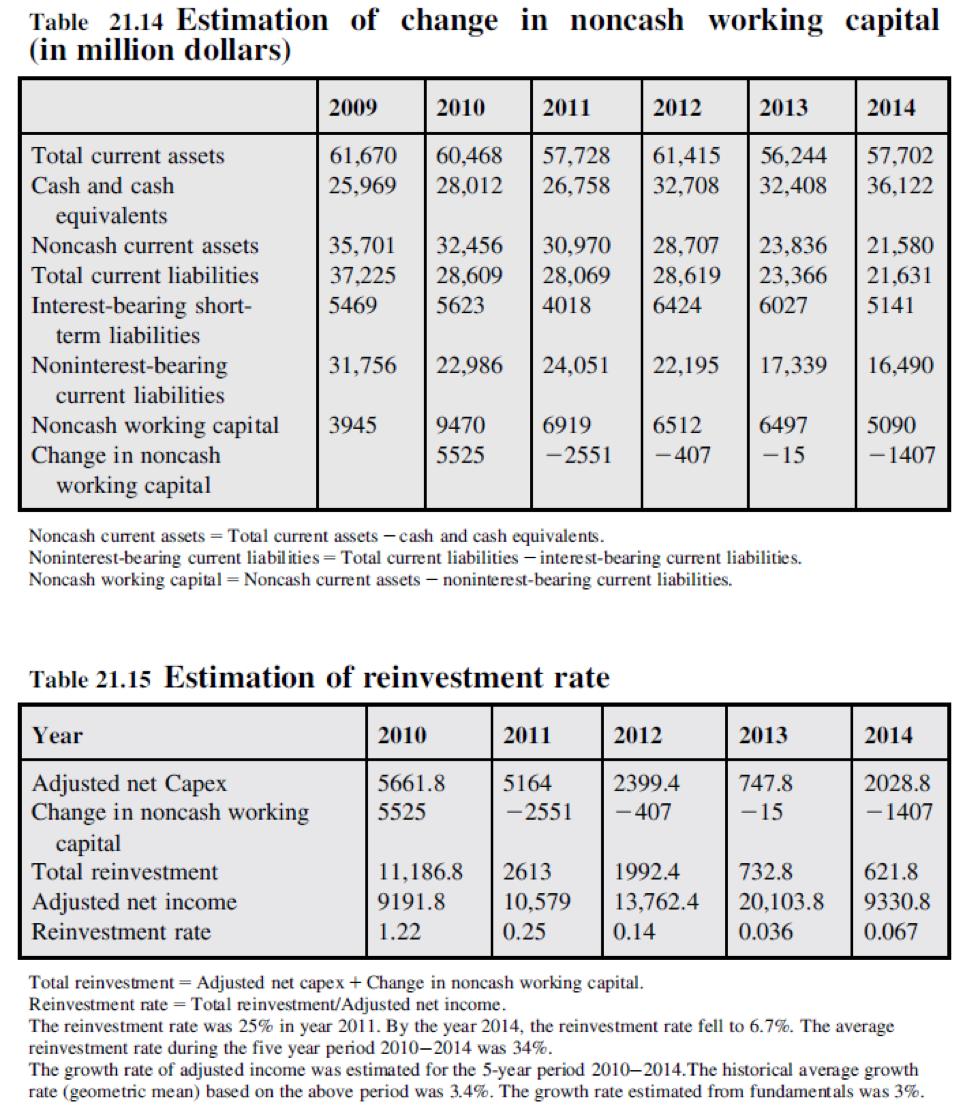
Valuation (per share) of Pfizer will be done through the FCFE model. Inputs for estimating FCFE are given in the table below (Table 21.17):

Net Income + Depreciation & Amort – Gross Capital Expenditures – Change in Net Working Capital + New Debt & Equity Issues – Principal Repayments – Preferred Dividends

Other information available
The growth rate estimated from both historical and fundamental is approximately 3%. Two-stage growth scenario is assumed in which the net income will grow by 3% in the first stage for 5 years and then by the growth rate of the economy in the stable stage period.
Growth rate in stable period = 2.15%
Growth rate = Reinvestment rate *ROE of pharma industry sector
ROE of pharma industry = 16.4%
Reinvestment rate = 2.15/16.4 = 13%
The reinvestment rate in the stable period is estimated at 13%.
No additional information concerning the repayment of old debt and new debt issuance has been provided.
Allergan plans to acquire Pfizer Value. To help Allergan define an offer price, assess Pfizer's intrinsic value through FCFE methodology assuming a two-stage growth scenario.
Table 21.2 Profitability trends Year Net profit margin (%) ROA (%) ROE (%) ROCE (%) 2005 2006 2007 2008 2009 2010 2011 2012 2013 24.7 15.75 39.97 16.81 16.78 17.27 12.18 14.84 42.65 5.33 4.05 5.23 7.8 12.3 12.1 6.7 16.64 7.08 7.16 28.29 11.96 13.24 9.89 24.29 10.8 11.17 9.01 7.28 8.83 13.15 19.9 11.71 9.29 11.78 17.84 27.94 2014 18.42 5.35 12.38 8.28 The net profit margin was highest in the year 2013. The profitability ratios of ROA, ROE, ROCE was highest in the year 2006. The average net profit margin was 21% during the period 2005-2009, while the average net profit margin was 22.6% during the period 2010-2014. The period 2005-2009 registered an average ROA of 8.58% in the year 2005-2009, while the average ROA fell to 6.95% during the period 2010-2014. The average ROE during the period 2005-2009 and 2010-2014 was approximately 15% and 16%, respectively. The average ROCE was 13% and 11.5% during the period 2005-2009 and 2010-2014, respectively.
Step by Step Solution
3.33 Rating (147 Votes )
There are 3 Steps involved in it
Step: 1
A business valuation is a general process of determining the economic value of a whole business or company unit Business valuation can be used to determine the fair value of a business for a variety o...
Get Instant Access to Expert-Tailored Solutions
See step-by-step solutions with expert insights and AI powered tools for academic success
Step: 2

Step: 3

Ace Your Homework with AI
Get the answers you need in no time with our AI-driven, step-by-step assistance
Get Started


