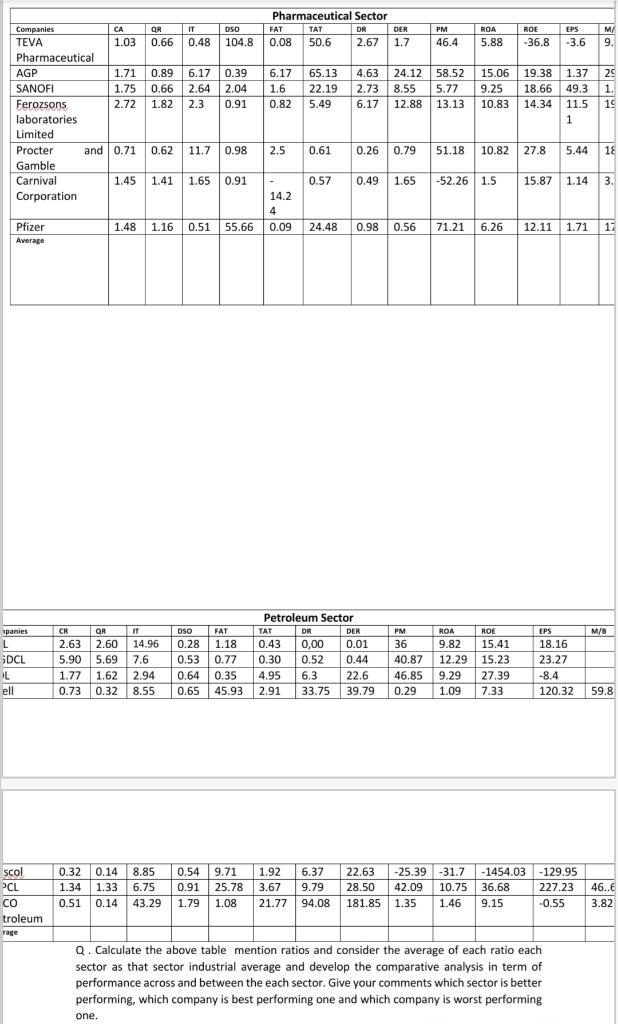
Pharmaceutical Sector CA QR IT DSO FAT TAT DR DER PM ROA ROE EPS M/ 0.48 104.8 0.08 50.6 2.67 1.7 46.4 5.88 -36.8 -3.6 9. 6.17 65.13 6.17 0.39 2.64 2.04 2.3 0.91 TIT 1.6 22.19 4.63 24.12 58.52 2.73 8.55 5.77 6.17 12.88 13.13 15.06 19.38 1.37 29 9.25 18.66 49.3 1. 10.83 14.34 14.34 11.5 19 1 0.82 Companies TEVA 1.03 0.66 Pharmaceutical AGP 1.71 0.89 SANOFI 1.75 0.66 Ferozsons 2.72 1.82 laboratories Limited Procter and 0.71 0.62 Gamble Carnival 1.45 1.41 Corporation 5.49 11.7 0.98 2.5 0.61 0.26 0.79 51.18 10.82 27.8 5.44 1 1.65 0.91 0.57 0.49 1.65 -52.26 1.5 15.87 1.14 3. 14.2 4 Pfizer 1.48 1.16 0.51 55.66 0.09 24.48 0.98 0.56 71.21 6.26 12.11 1.71 17 Average CR IT DSO FAT PM ROA ROE EPS M/B spanies L 14.96 36 Petroleum Sector TAT DR DER 0.43 0,00 0.01 0.30 0.52 0.44 4.95 6.3 22.6 9.82 QR 2.63 2.60 5.90 5.69 1.77 1.62 0.73 0.32 0.28 1.18 0.53 0.77 0.64 0.35 18.16 23.27 7.6 SDCL L ell 12.29 40.87 46.85 15.41 15.23 27.39 7.33 2.94 9.29 -8.4 8.55 0.65 45.93 2.91 33.75 39.79 0.29 1.09 120.32 59.8 scol 8.85 6.37 22.63 0.32 0.14 1.34 1.33 -25.39 -31.7 42.09 10.75 0.54 9.71 1.92 0.91 25.78 3.67 1.79 1.08 21.77 -1454.03 -129.95 36.68 227.23 PCL 6.75 9.79 28.50 46..6 0.51 0.14 43.29 94.08 181.85 1.35 1.46 9.15 -0.55 3.82 CO troleum rage Q. Calculate the above table mention ratios and consider the average of each ratio each sector as that sector industrial average and develop the comparative analysis in term of performance across and between the each sector. Give your comments which sector is better performing, which company is best performing one and which company is worst performing one. Pharmaceutical Sector CA QR IT DSO FAT TAT DR DER PM ROA ROE EPS M/ 0.48 104.8 0.08 50.6 2.67 1.7 46.4 5.88 -36.8 -3.6 9. 6.17 65.13 6.17 0.39 2.64 2.04 2.3 0.91 TIT 1.6 22.19 4.63 24.12 58.52 2.73 8.55 5.77 6.17 12.88 13.13 15.06 19.38 1.37 29 9.25 18.66 49.3 1. 10.83 14.34 14.34 11.5 19 1 0.82 Companies TEVA 1.03 0.66 Pharmaceutical AGP 1.71 0.89 SANOFI 1.75 0.66 Ferozsons 2.72 1.82 laboratories Limited Procter and 0.71 0.62 Gamble Carnival 1.45 1.41 Corporation 5.49 11.7 0.98 2.5 0.61 0.26 0.79 51.18 10.82 27.8 5.44 1 1.65 0.91 0.57 0.49 1.65 -52.26 1.5 15.87 1.14 3. 14.2 4 Pfizer 1.48 1.16 0.51 55.66 0.09 24.48 0.98 0.56 71.21 6.26 12.11 1.71 17 Average CR IT DSO FAT PM ROA ROE EPS M/B spanies L 14.96 36 Petroleum Sector TAT DR DER 0.43 0,00 0.01 0.30 0.52 0.44 4.95 6.3 22.6 9.82 QR 2.63 2.60 5.90 5.69 1.77 1.62 0.73 0.32 0.28 1.18 0.53 0.77 0.64 0.35 18.16 23.27 7.6 SDCL L ell 12.29 40.87 46.85 15.41 15.23 27.39 7.33 2.94 9.29 -8.4 8.55 0.65 45.93 2.91 33.75 39.79 0.29 1.09 120.32 59.8 scol 8.85 6.37 22.63 0.32 0.14 1.34 1.33 -25.39 -31.7 42.09 10.75 0.54 9.71 1.92 0.91 25.78 3.67 1.79 1.08 21.77 -1454.03 -129.95 36.68 227.23 PCL 6.75 9.79 28.50 46..6 0.51 0.14 43.29 94.08 181.85 1.35 1.46 9.15 -0.55 3.82 CO troleum rage Q. Calculate the above table mention ratios and consider the average of each ratio each sector as that sector industrial average and develop the comparative analysis in term of performance across and between the each sector. Give your comments which sector is better performing, which company is best performing one and which company is worst performing one