Answered step by step
Verified Expert Solution
Question
1 Approved Answer
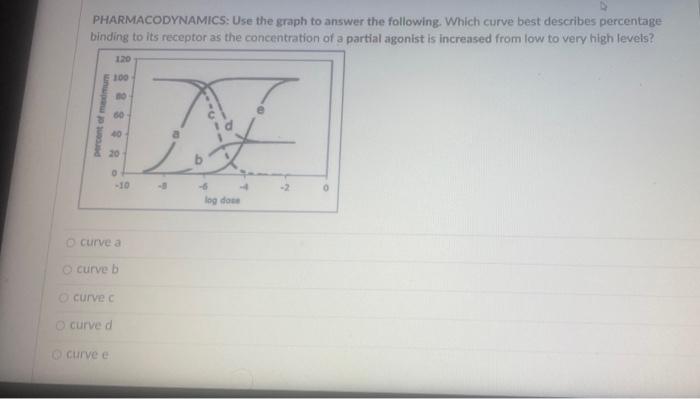
PHARMACODYNAMICS: Use the graph to answer the following. Which curve best describes percentage binding to its receptor as the concentration of a partial agonist


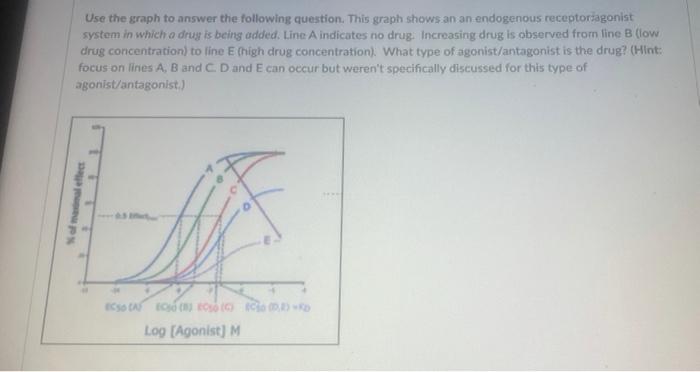
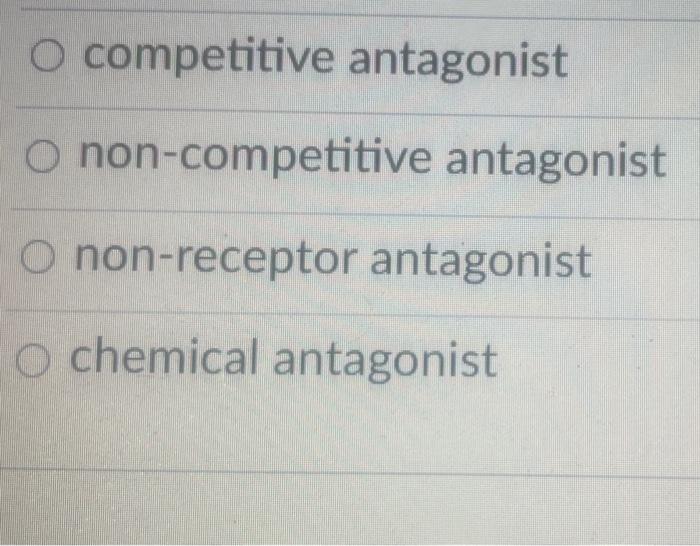
PHARMACODYNAMICS: Use the graph to answer the following. Which curve best describes percentage binding to its receptor as the concentration of a partial agonist is increased from low to very high levels? percent of madmum 120 100 curve e BO 60 40 20 O curve c O curve d O curve a O curve b A -6 0 -10 -B log dose N Use the graph to answer the following question. This graph shows an an endogenous receptor agonist system in which a drug is being added. Line A indicates no drug. Increasing drug is observed from line B (low drug concentration) to line E (high drug concentration). What type of agonist/antagonist is the drug? (Hint: focus on lines A, B and C D and E can occur but weren't specifically discussed for this type of agonist/antagonist.) % of maximal effect ECSO CA ECO (8) EOS (G) 008) RD Log [Agonist] M O competitive antagonist O non-competitive antagonist O non-receptor antagonist O chemical antagonist
Step by Step Solution
There are 3 Steps involved in it
Step: 1
The detailed answer for the above question is provided below Question 1 curve b EXPLANATION OF THE A...
Get Instant Access to Expert-Tailored Solutions
See step-by-step solutions with expert insights and AI powered tools for academic success
Step: 2

Step: 3

Ace Your Homework with AI
Get the answers you need in no time with our AI-driven, step-by-step assistance
Get Started


