

Answered step by step
Verified Expert Solution
Question
1 Approved Answer
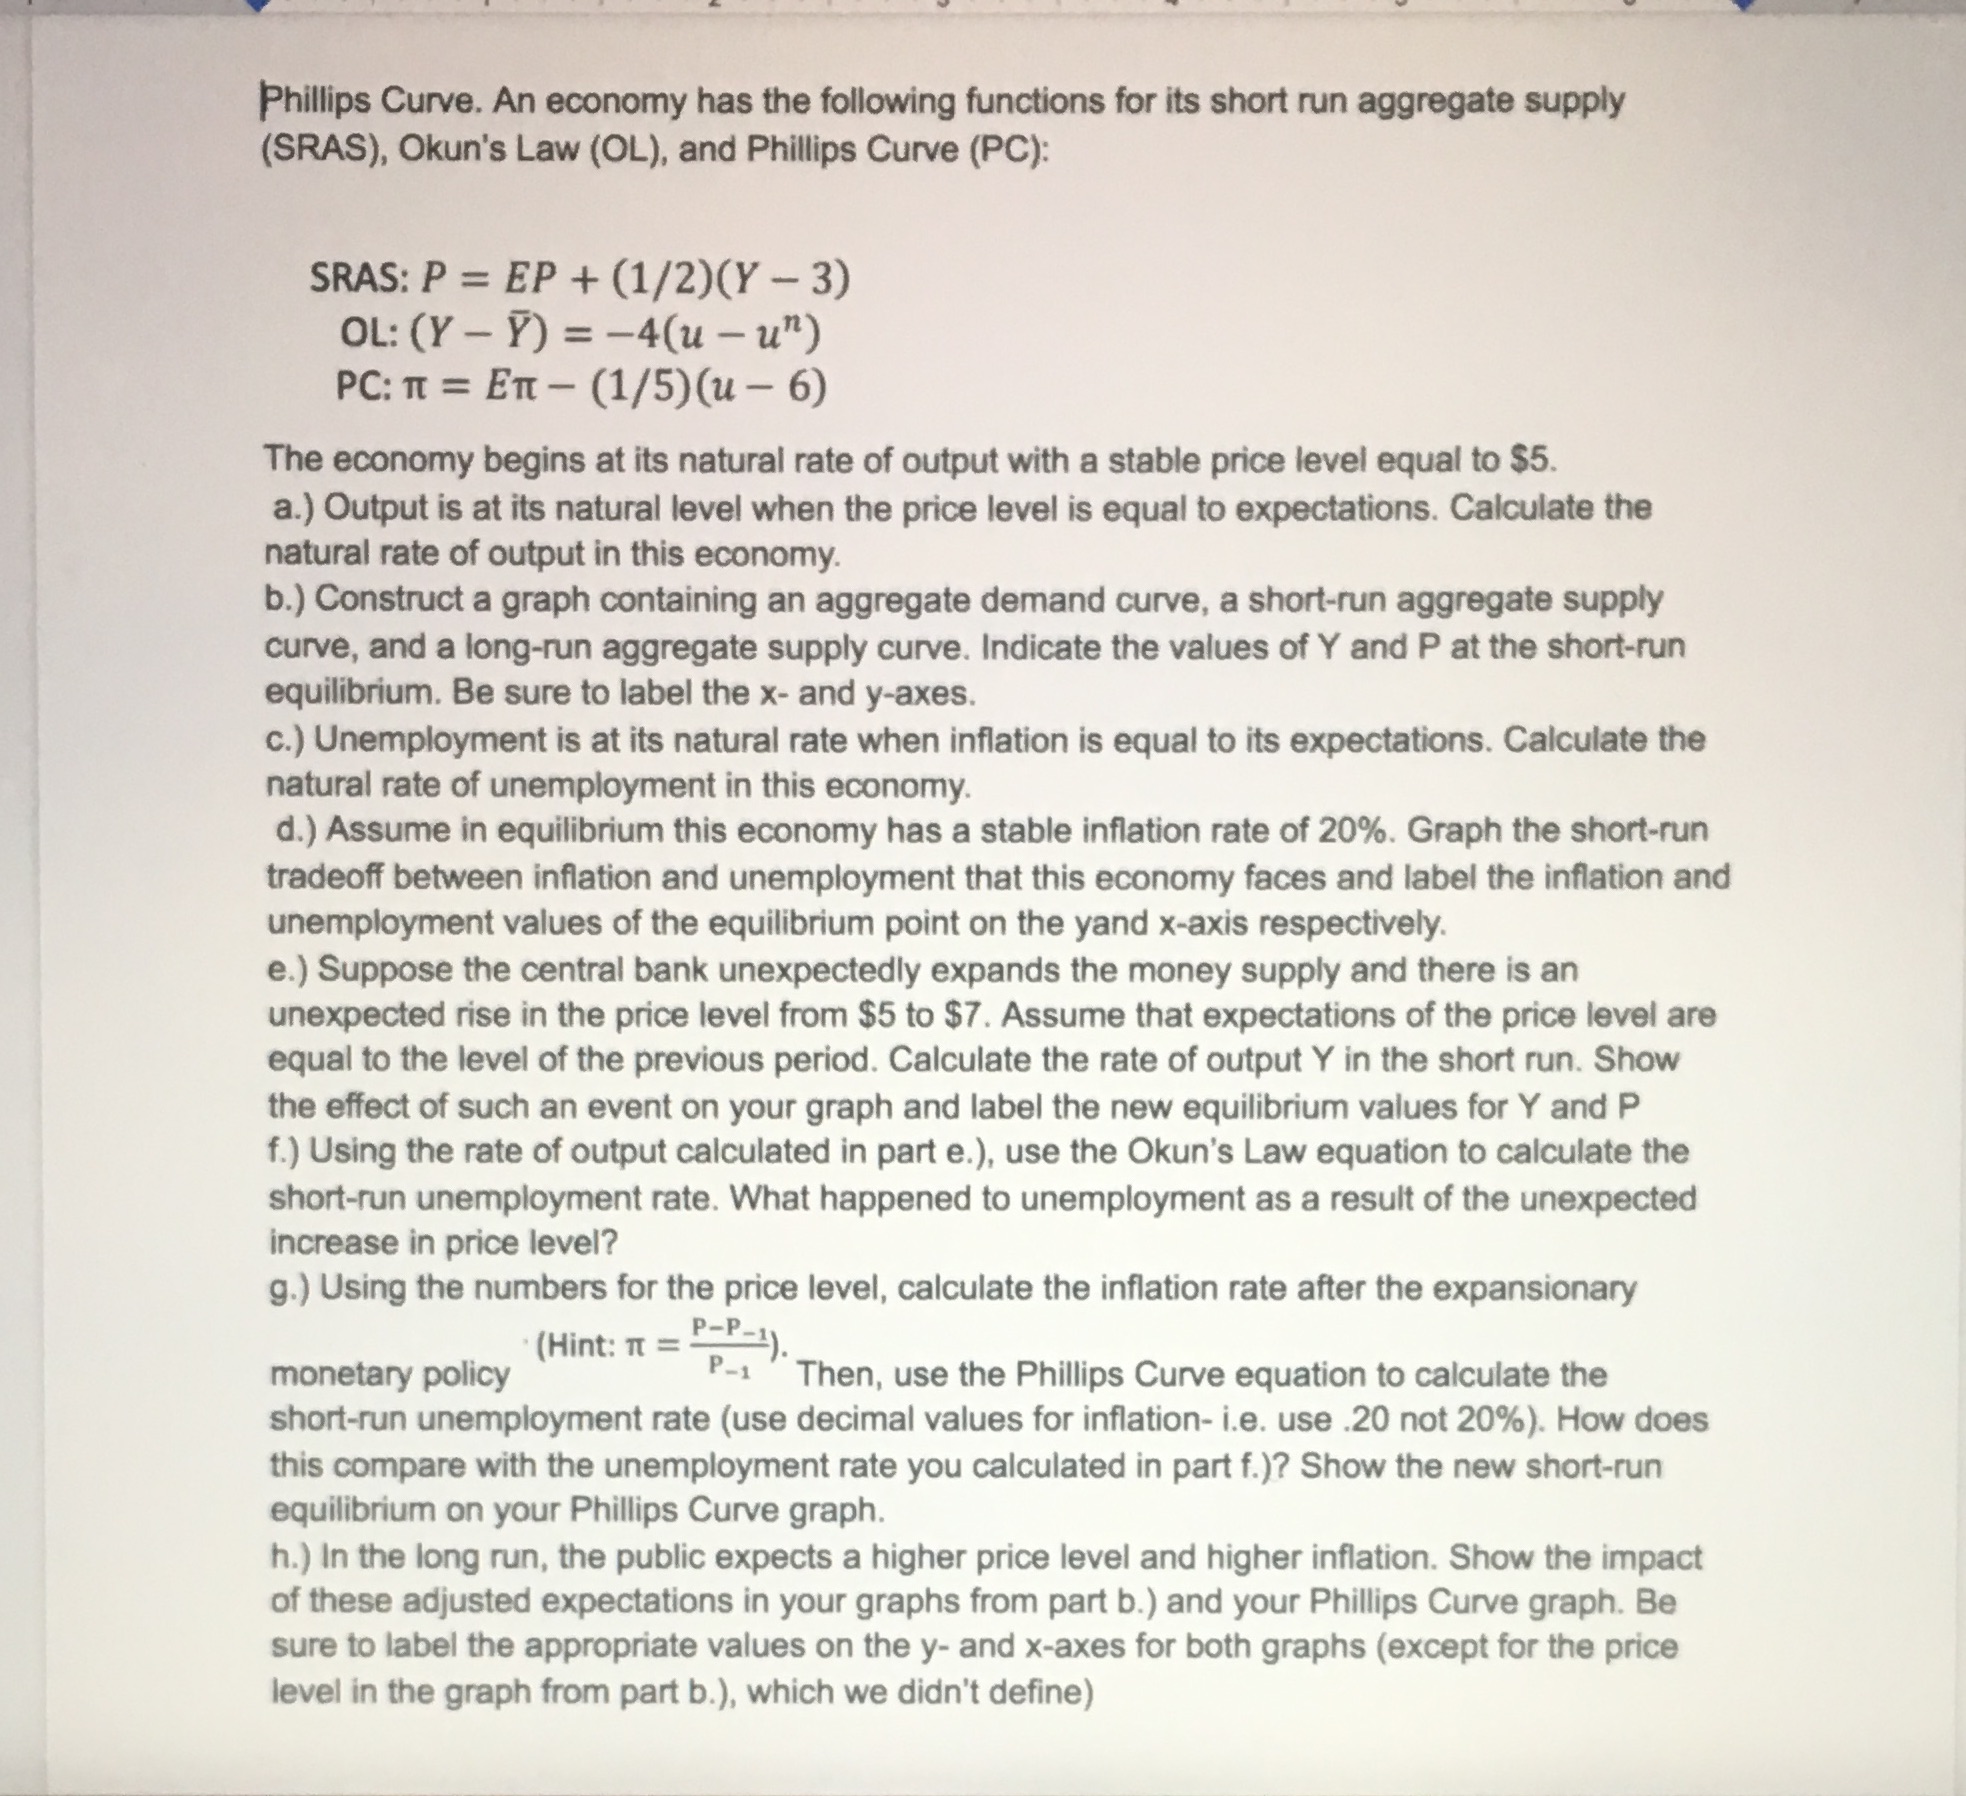
Phillips Curve. An economy has the following functions for its short run aggregate supply (SRAS), Okun's Law (OL), and Phillips Curve (PC): SRAS: P =
Step by Step Solution
There are 3 Steps involved in it
Step: 1

Get Instant Access to Expert-Tailored Solutions
See step-by-step solutions with expert insights and AI powered tools for academic success
Step: 2

Step: 3
Ace Your Homework with AI
Get the answers you need in no time with our AI-driven, step-by-step assistance
Get Started
Managerial Economics A Problem-Solving Approach
Authors: Luke M. Froeb, Brain T. Mccann
2nd Edition
B00BTM8FK0