

Question
Pick a bank or financial services firm you would like to analyze. The bank should be publicly traded and have a minimum market capitalization of
Pick a bank or financial services firm you would like to analyze. The bank should be publicly traded and have a minimum market capitalization of $20 billion. You may use many sources to verify the market cap, including but not limited to Yahoo or Google finance pages. Once you have your bank selected, you must also identify a competitor that is similar in size and operations. After you have picked your bank and your competitor, you will construct an Excel workbook with 5 sheets. The five sheets should be:
1. Ratios 2. Your banks balance sheet 3. Your banks income statement 4. Your competitors balance sheet 5. Your competitors income statement
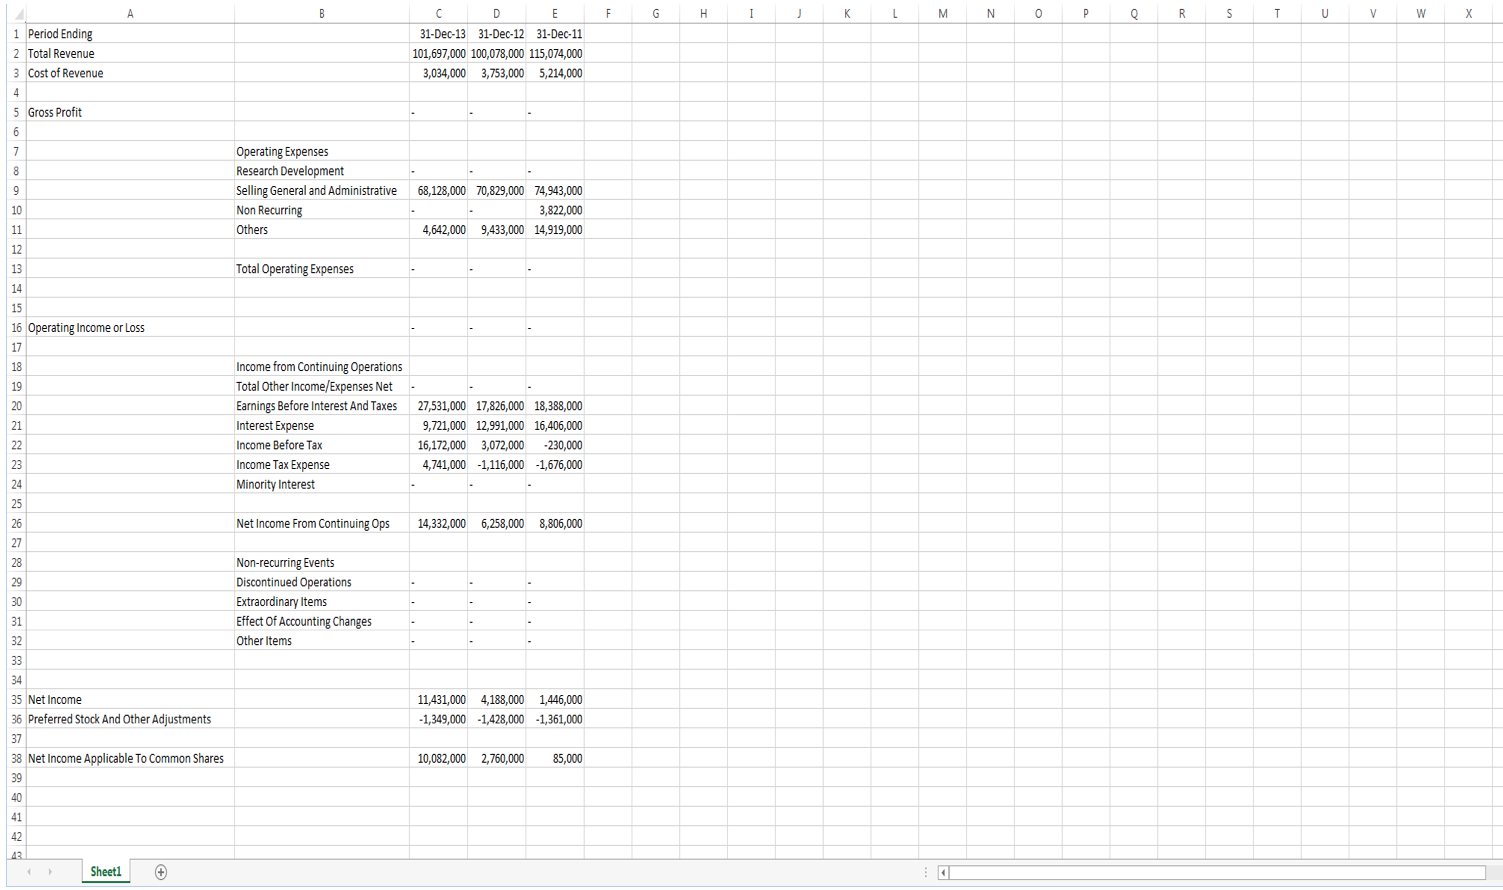
Once completed, you will have four statements in total. The next step is to create the ratio page. To do this, you will calculate the following ratios: Return on Equity Return on Assets Net Interest Margin Current Ratio P/E Ratio (Use the stock price that matches the statement date. This can be found using the historical prices link on both Yahoo and Google Finance). You will need to calculate the ratio for each of the last three years for each company. You should use cell referencing to calculate the ratios. Your final sheet should like something like this:
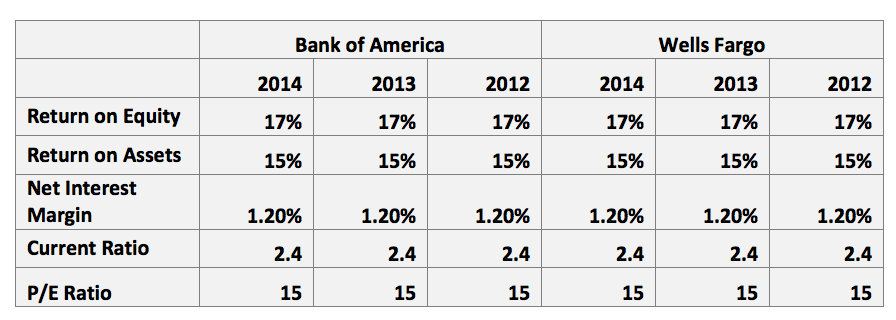 \begin{tabular}{|l|r|r|r|r|r|r|} \hline & \multicolumn{3}{|c|}{ Bank of America } & \multicolumn{3}{|c|}{ Wells Fargo } \\ \hline & 2014 & 2013 & 2012 & 2014 & 2013 & 2012 \\ \hline Return on Equity & 17% & 17% & 17% & 17% & 17% & 17% \\ \hline Return on Assets & 15% & 15% & 15% & 15% & 15% & 15% \\ \hline NetInterestMargin & 1.20% & 1.20% & 1.20% & 1.20% & 1.20% & 1.20% \\ \hline Current Ratio & 2.4 & 2.4 & 2.4 & 2.4 & 2.4 & 2.4 \\ \hline P/E Ratio & 15 & 15 & 15 & 15 & 15 & 15 \\ \hline \end{tabular} \begin{tabular}{|l|r|r|r|r|r|r|} \hline & \multicolumn{3}{|c|}{ Bank of America } & \multicolumn{3}{|c|}{ Wells Fargo } \\ \hline & 2014 & 2013 & 2012 & 2014 & 2013 & 2012 \\ \hline Return on Equity & 17% & 17% & 17% & 17% & 17% & 17% \\ \hline Return on Assets & 15% & 15% & 15% & 15% & 15% & 15% \\ \hline NetInterestMargin & 1.20% & 1.20% & 1.20% & 1.20% & 1.20% & 1.20% \\ \hline Current Ratio & 2.4 & 2.4 & 2.4 & 2.4 & 2.4 & 2.4 \\ \hline P/E Ratio & 15 & 15 & 15 & 15 & 15 & 15 \\ \hline \end{tabular}
 Step by Step Solution
There are 3 Steps involved in it
Step: 1

Get Instant Access to Expert-Tailored Solutions
See step-by-step solutions with expert insights and AI powered tools for academic success
Step: 2

Step: 3
Ace Your Homework with AI
Get the answers you need in no time with our AI-driven, step-by-step assistance
Get Started
Enhancing Financial Inclusion Through Islamic Finance Volume II
Authors: Abdelrahman Elzahi Saaid Ali , Khalifa Mohamed Ali , Mohamed Hassan Azrag
1st Edition
3030399389,3030399397