Pick two account to analyze (Ex: Account receivable, Cash, Account payable, Sales , cost of goods sold.)
analysis. (4 years)
1. Set level of materiality (Ex : change of 25% or higher ) 2. Make a conclusion for each account (1. point ) o The auditor should pay more attention to the sales account. It decreased by 45% 2017 and by 66% in 2018. Interestingly, the percentage of change dropped in 2019. However, the sales changes did not exceed our threshold limit of 25%, which means the changes is within the acceptable range. o The changes in the COGS were not significant. It was relatively the same during the last three years. 3. Make a conclusion for Both Accounts (.5 point) o The COGS remained relatively the same despite the slight increase in the sale. The auditor must consider the cause of this inconsistency to ensure that no vicious sales were recoded or that no costs were missed Formula: (THE YEAR /THE BASE YEAR)*100 = CHANGE RELATIVE TO BASE YEAR
Solve the above question as in the example below The table below is a solution to a different question
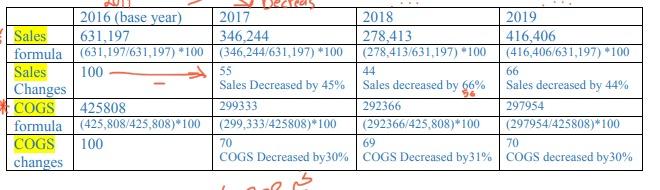
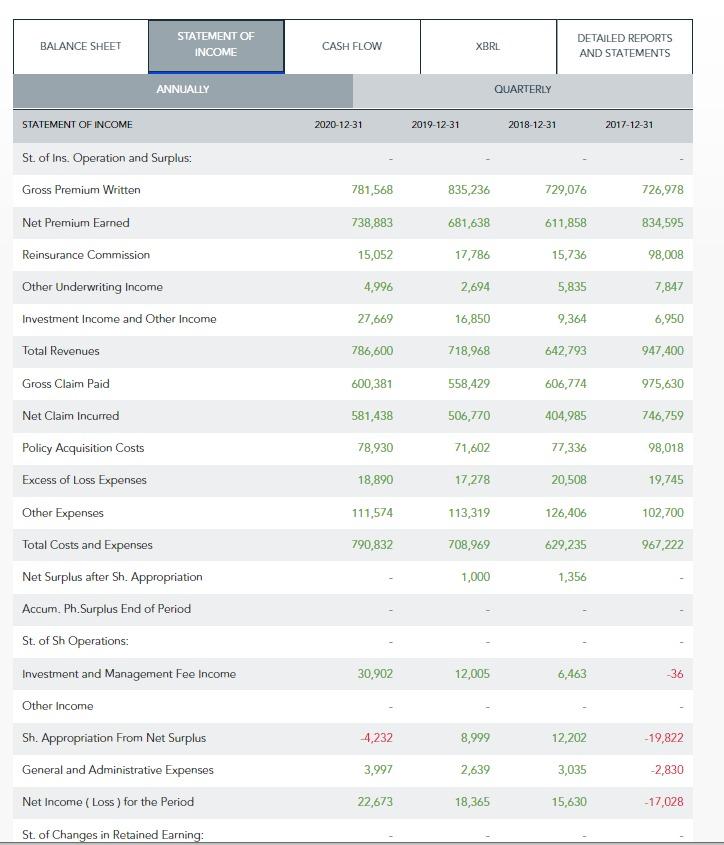
BALANCE SHEET STATEMENT OF INCOME CASH FLOW XBRL DETAILED REPORTS AND STATEMENTS ANNUALLY QUARTERLY STATEMENT OF INCOME 2020-12-31 2019-12-31 2018-12-31 2017-12-31 St. of Ins. Operation and Surplus: Gross Premium Written 781,568 835,236 729,076 726,978 738,883 681,638 611,858 834,595 Net Premium Earned Reinsurance Commission 15,052 17,786 15,736 98,008 4,996 2,694 5,835 7,847 Other Underwriting Income Investment Income and Other Income Total Revenues 27,669 16,850 9,364 6,950 786,600 718,968 642,793 947,400 Gross Claim Paid 600,381 558,429 606,774 975,630 Net Claim Incurred 581,438 506,770 404,985 746,759 78,930 71,602 77,336 98,018 Policy Acquisition Costs Excess of Loss Expenses 18,890 17 278 20,508 19,745 Other Expenses 111,574 113,319 126,406 102,700 790,832 708,969 629,235 967.222 1,000 1,356 Total Costs and Expenses Net Surplus after Sh. Appropriation Accum. Ph. Surplus End of Period St. of Sh Operations: Investment and Management Fee Income 30,902 12,005 6,463 36 4,232 8,999 12,202 -19,822 Other Income Sh. Appropriation From Net Surplus General and Administrative Expenses Net Income (Loss) for the Period 3,997 2,639 3,035 -2,830 22,673 18,365 15,630 -17,028 St. of Changes in Retained Earning: 2016 (base year) Sales 631,197 formula (631,197/631,197) 100 Sales 100 Changes COGS 425808 formula (425,808/425,808) 100 COGS 100 changes 2017 2018 2019 346,244 278,413 416,406 (346,244/631,197) "100 (278,413/631,197) 100 (416,406/631,197) 100 55 44 66 Sales Decreased by 45% Sales decreased by 66% Sales decreased by 44% 299333 292366 297954 (299,333/425808)*100 (292366/425,808)*100 (297954/425808) 100 70 69 70 COGS Decreased by 30% COGS Decreased by31% COGS decreased by 30% BALANCE SHEET STATEMENT OF INCOME CASH FLOW XBRL DETAILED REPORTS AND STATEMENTS ANNUALLY QUARTERLY STATEMENT OF INCOME 2020-12-31 2019-12-31 2018-12-31 2017-12-31 St. of Ins. Operation and Surplus: Gross Premium Written 781,568 835,236 729,076 726,978 738,883 681,638 611,858 834,595 Net Premium Earned Reinsurance Commission 15,052 17,786 15,736 98,008 4,996 2,694 5,835 7,847 Other Underwriting Income Investment Income and Other Income Total Revenues 27,669 16,850 9,364 6,950 786,600 718,968 642,793 947,400 Gross Claim Paid 600,381 558,429 606,774 975,630 Net Claim Incurred 581,438 506,770 404,985 746,759 78,930 71,602 77,336 98,018 Policy Acquisition Costs Excess of Loss Expenses 18,890 17 278 20,508 19,745 Other Expenses 111,574 113,319 126,406 102,700 790,832 708,969 629,235 967.222 1,000 1,356 Total Costs and Expenses Net Surplus after Sh. Appropriation Accum. Ph. Surplus End of Period St. of Sh Operations: Investment and Management Fee Income 30,902 12,005 6,463 36 4,232 8,999 12,202 -19,822 Other Income Sh. Appropriation From Net Surplus General and Administrative Expenses Net Income (Loss) for the Period 3,997 2,639 3,035 -2,830 22,673 18,365 15,630 -17,028 St. of Changes in Retained Earning: 2016 (base year) Sales 631,197 formula (631,197/631,197) 100 Sales 100 Changes COGS 425808 formula (425,808/425,808) 100 COGS 100 changes 2017 2018 2019 346,244 278,413 416,406 (346,244/631,197) "100 (278,413/631,197) 100 (416,406/631,197) 100 55 44 66 Sales Decreased by 45% Sales decreased by 66% Sales decreased by 44% 299333 292366 297954 (299,333/425808)*100 (292366/425,808)*100 (297954/425808) 100 70 69 70 COGS Decreased by 30% COGS Decreased by31% COGS decreased by 30%