picture 2
picture 3
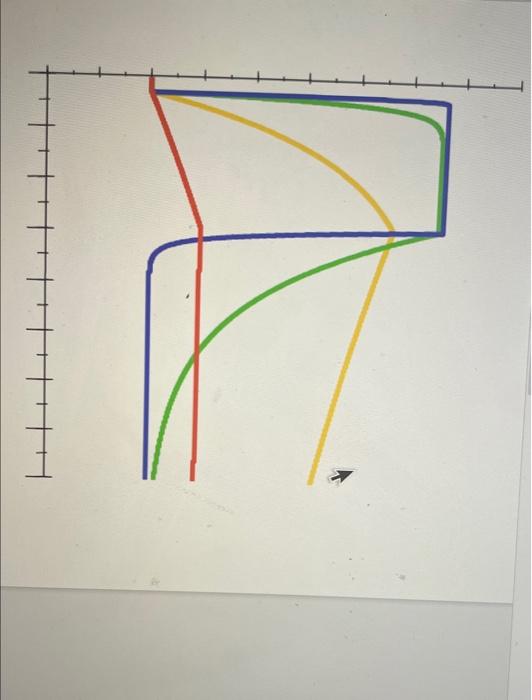
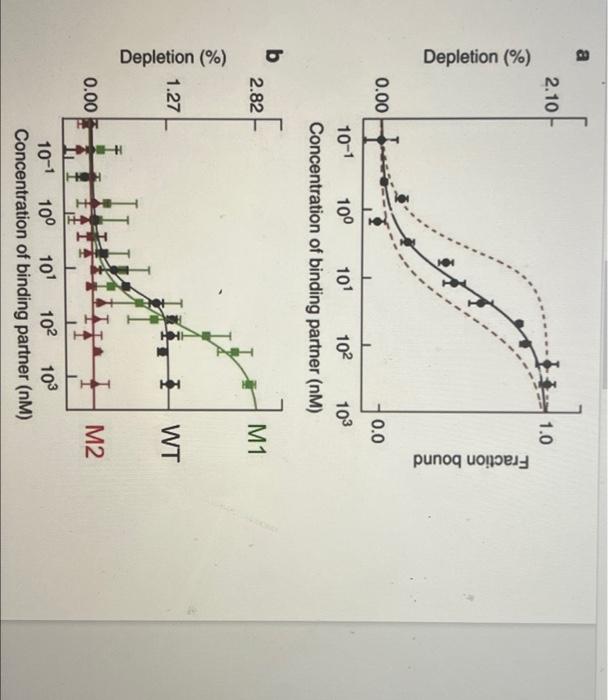
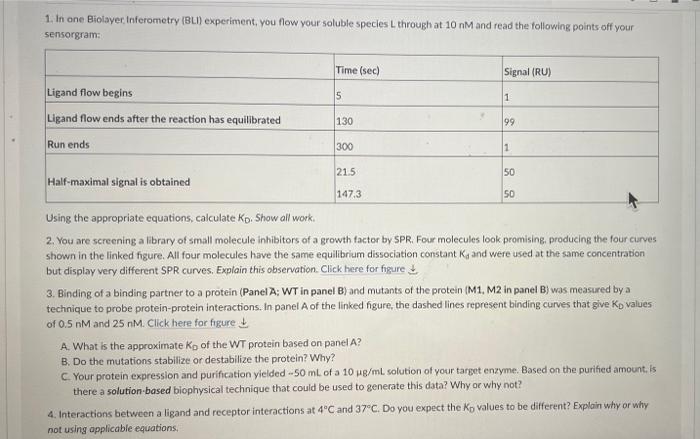
1. In one Biolayer Inferometry (BLI) experiment, you flow your soluble species through at 10 nM and read the following points off your sensorgram: Time (sec) Signal (RU) Ligand flow begins 5 1 Ligand flow ends after the reaction has equilibrated 130 99 Run ends 300 1 50 21.5 Half-maximal signal is obtained 50 147.3 Using the appropriate equations, calculate Kp. Show all work. 2. You are screening a library of small molecule inhibitors of a growth factor by SPR. Four molecules look promising, producing the four curves shown in the linked figure. All four molecules have the same equilibrium dissociation constant Ky and were used at the same concentration but display very different SPR curves. Explain this observation. Click here for figure 3. Binding of a binding partner to a protein (Panel A: WT in panel B) and mutants of the protein (M1, M2 in panel B) was measured by a technique to probe protein-protein interactions. In panel of the linked figure, the dashed lines represent binding curves that give Kp values of 0.5 nM and 25 nM. Click here for figure A. What is the approximate Ko of the WT protein based on panel A? B. Do the mutations stabilize or destabilize the protein? Why? C. Your protein expression and purification yielded - 50 ml of a 10 mg/ml solution of your target enzyme. Based on the purified amount is there a solution-based biophysical technique that could be used to generate this data? Why or why not? 4. Interactions between a ligand and receptor interactions at 4C and 37C. Do you expect the Ko values to be different? Explain why or why not using applicable equations, a 2.10 1.0 Depletion (%) Fraction bound 0.00 0.0 102 103 10-1 100 101 Concentration of binding partner (NM) b 2.82 M1 1.27 I WT 0.00 M2 100 10-1 101 102 103 Concentration of binding partner (NM) 1. In one Biolayer Inferometry (BLI) experiment, you flow your soluble species through at 10 nM and read the following points off your sensorgram: Time (sec) Signal (RU) Ligand flow begins 5 1 Ligand flow ends after the reaction has equilibrated 130 99 Run ends 300 1 50 21.5 Half-maximal signal is obtained 50 147.3 Using the appropriate equations, calculate Kp. Show all work. 2. You are screening a library of small molecule inhibitors of a growth factor by SPR. Four molecules look promising, producing the four curves shown in the linked figure. All four molecules have the same equilibrium dissociation constant Ky and were used at the same concentration but display very different SPR curves. Explain this observation. Click here for figure 3. Binding of a binding partner to a protein (Panel A: WT in panel B) and mutants of the protein (M1, M2 in panel B) was measured by a technique to probe protein-protein interactions. In panel of the linked figure, the dashed lines represent binding curves that give Kp values of 0.5 nM and 25 nM. Click here for figure A. What is the approximate Ko of the WT protein based on panel A? B. Do the mutations stabilize or destabilize the protein? Why? C. Your protein expression and purification yielded - 50 ml of a 10 mg/ml solution of your target enzyme. Based on the purified amount is there a solution-based biophysical technique that could be used to generate this data? Why or why not? 4. Interactions between a ligand and receptor interactions at 4C and 37C. Do you expect the Ko values to be different? Explain why or why not using applicable equations, a 2.10 1.0 Depletion (%) Fraction bound 0.00 0.0 102 103 10-1 100 101 Concentration of binding partner (NM) b 2.82 M1 1.27 I WT 0.00 M2 100 10-1 101 102 103 Concentration of binding partner (NM)