picture are the question. here is my code from part a.
# read_temp_file.py
while True:
temp=input("Temperature anomaly filename:")
try:
#check valid input or not
infile=open(temp,"r")
print("Analyzing",temp)
break
except :
print("Could not open ",temp)
#again reading input
#exiting the while loop
for i in range (5):
infile.readline()
for line in infile:
line=line.strip()
year,temp=line.split(',')
temp=float(temp)
infile.close()
# A variable used to see if you have to ask again or not
repeat = True
# loop while the repeat value is true
while(repeat == True):
# ask the user for the input
window = input("Enter an integer between 0 and 60:")
# if the entered value cannot be be converted to an integer
# give error and ask again
if(window.isnumeric() == False):
print("Enter an integer.")
else:
# if it could be converted, convert it into an integer and check if it is
# in range, else give an error message.
window= int(window)
if(window 60):
print("Enter an integer up to 60.")
else:
repeat = False
print(f"Using {window} for the window parameter.")
# Write you required code which uses the window value here

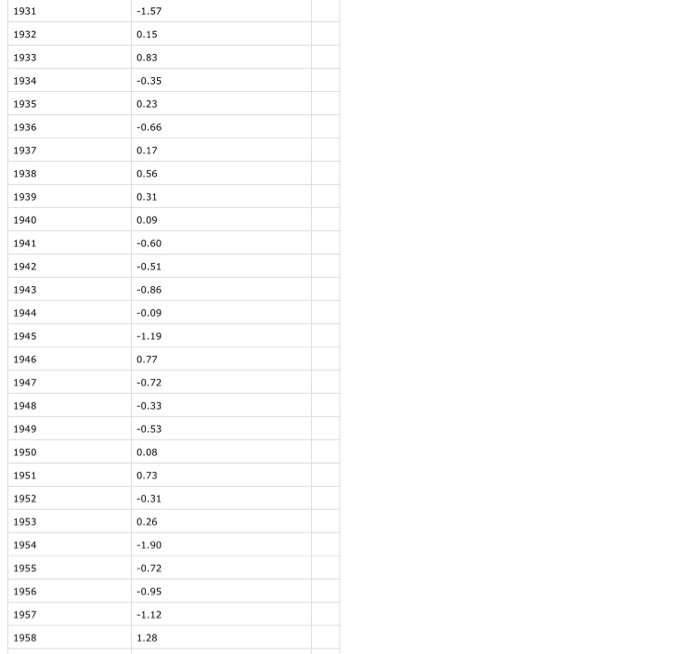
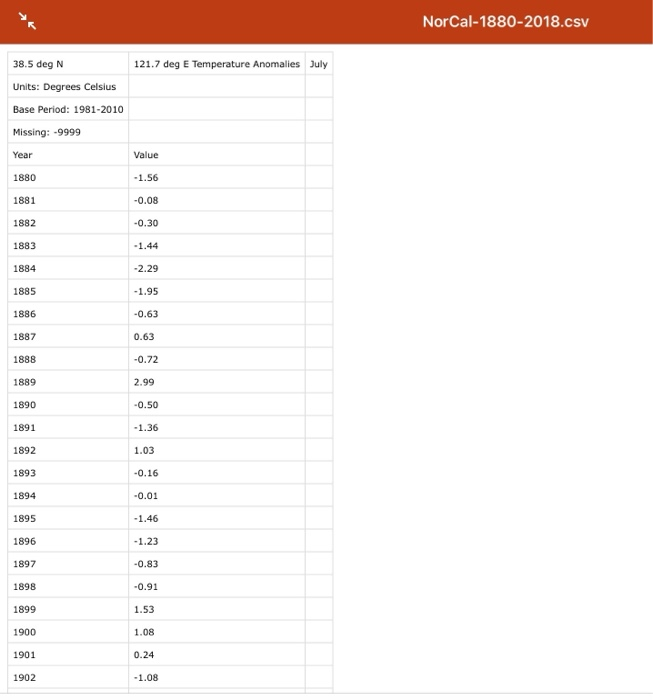
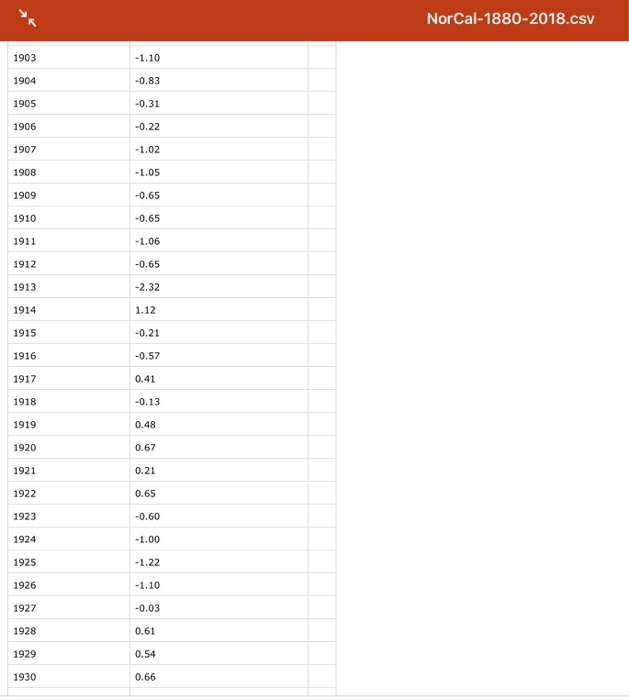
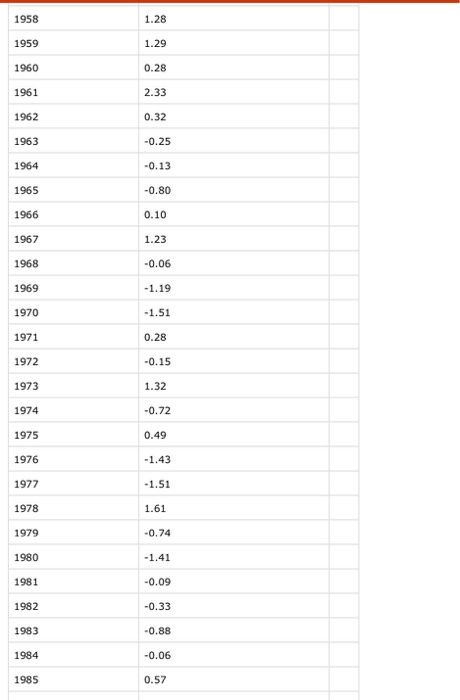
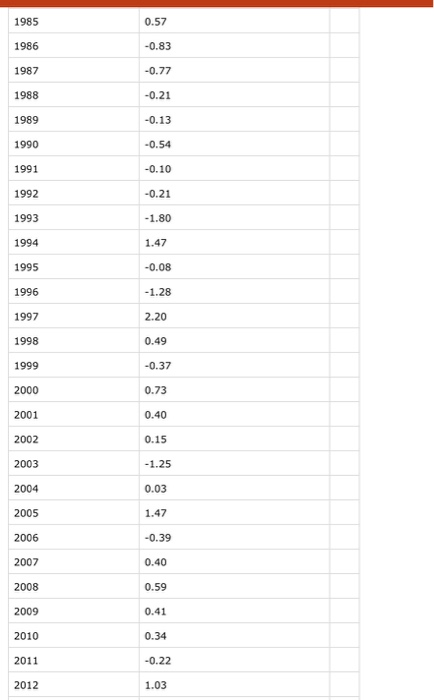
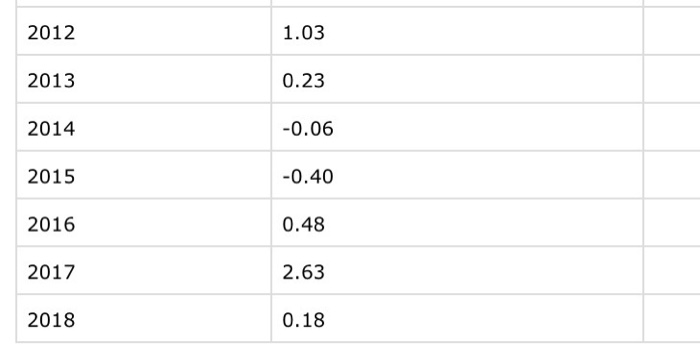
this is the norcal data
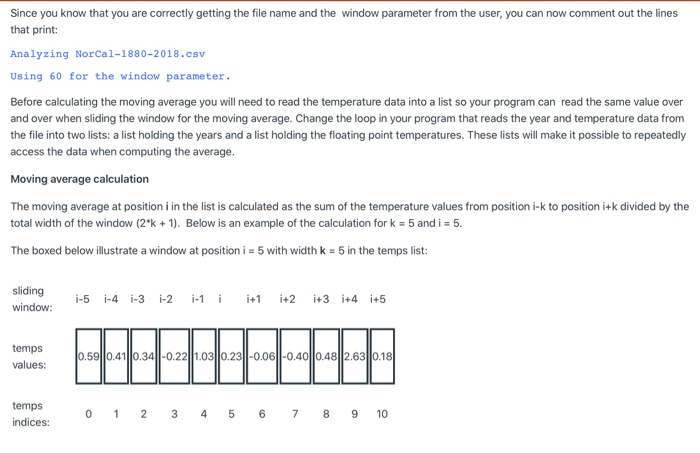
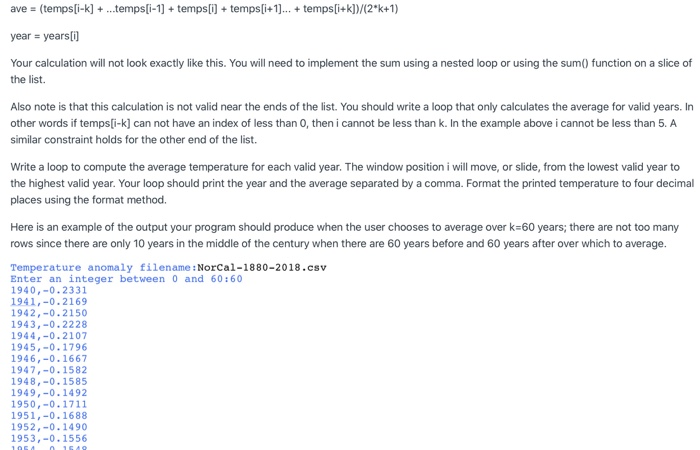
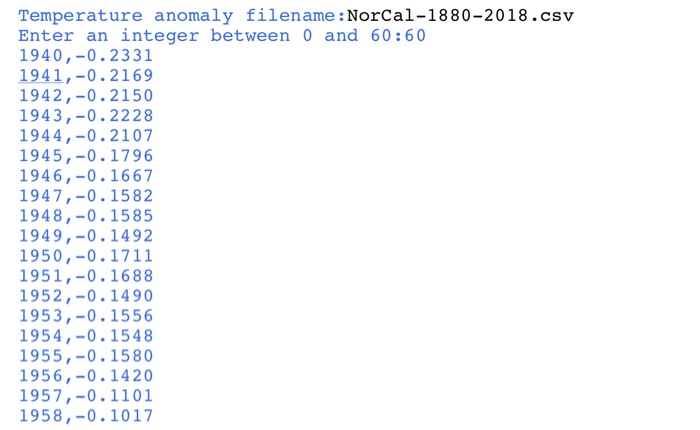
Since you know that you are correctly getting the file name and the window parameter from the user, you can now comment out the lines that print: Analyzing NorCal-1880-2018.csv Using 60 for the window parameter. Before calculating the moving average you will need to read the temperature data into a list so your program can read the same value over and over when sliding the window for the moving average. Change the loop in your program that reads the year and temperature data from the file into two lists: a list holding the years and a list holding the floating point temperatures. These lists will make it possible to repeatedly access the data when computing the average. Moving average calculation The moving average at position i in the list is calculated as the sum of the temperature values from position i-k to position i+k divided by the total width of the window (2*k + 1). Below is an example of the calculation fo low is an example of the calculation for k = 5 and i = 5. The boxed below illustrate a window at position i = 5 with width k = 5 in the temps list: sliding window: i-5 i-4 -3 1-2 i-1 i i+1 i+2 i+3 i+4 i+5 temps values: 10.590.41||0.34||-0.221.03||0.23||-0.06|-0.40||0.48||2.63||0.18 temps indices: 0 1 2 3 4 5 6 7 8 9 10 ave = (temps[i-k] + ...temps[i-1] + temps[i] + temps [i+1)... + temps [i+k])/(2*k+1) year = years Your calculation will not look exactly like this. You will need to implement the sum using a nested loop or using the sum() function on a slice of the list. Also note is that this calculation is not valid near the ends of the list. You should write a loop that only calculates the average for valid years. In other words if temps[i-k] can not have an index of less than 0, then i cannot be less than k. In the example above i cannot be less than 5. A similar constraint holds for the other end of the list. Write a loop to compute the average temperature for each valid year. The window position i will move, or slide, from the lowest valid year to the highest valid year. Your loop should print the year and the average separated by a comma. Format the printed temperature to four decimal places using the format method. Here is an example of the output your program should produce when the user chooses to average over k=60 years, there are not too many rows since there are only 10 years in the middle of the century when there are 60 years before and 60 years after over which to average. Temperature anomaly filename: NorCal-1880-2018.csv Enter an integer between 0 and 60:60 1940,-0.2331 1941,-0.2169 1942,-0.2150 1943,-0.2228 1944,-0.2107 1945,-0.1796 1946,-0.1667 1947,-0.1582 1948,-0.1585 1949,-0.1492 1950,-0.1711 1951,-0.1688 1952,-0.1490 1953,-0.1556 ave = (temps[i-k] + ...temps[i-1] + temps[i] + temps [i+1)... + temps[i+k])/(2*k+1) year = years Your calculation will not look exactly like this. You will need to implement the sum using a nested loop or using the sum() function on a slice of the list. Also note is that this calculation is not valid near the ends of the list. You should write a loop that only calculates the average for valid years. In other words if temps[i-k] can not have an index of less than 0, then i cannot be less than k. In the example above i cannot be less than 5. A similar constraint holds for the other end of the list. Write a loop to compute the average temperature for each valid year. The window position i will move, or slide, from the lowest valid year to the highest valid year. Your loop should print the year and the average separated by a comma. Format the printed temperature to four decimal places using the format method. Here is an example of the output your program should produce when the user chooses to average over k=60 years, there are not too many rows since there are only 10 years in the middle of the century when there are 60 years before and 60 years after over which to average. Temperature anomaly filename: NorCal-1880-2018.csv Enter an integer between 0 and 60:60 1940,-0.2331 1941,-0.2169 1942,-0.2150 1943,-0.2228 1944,-0.2107 1945,-0.1796 1946,-0.1667 1947,-0.1582 1948,-0.1585 1949,-0.1492 1950,-0.1711 1951,-0.1688 1952,-0.1490 1953,-0.1556 Temperature anomaly filename: NorCal-1880-2018.csv Enter an integer between 0 and 60:60 1940,-0.2331 1941,-0.2169 1942,-0.2150 1943,-0.2228 1944,-0.2107 1945,-0.1796 1946,-0.1667 1947,-0.1582 1948,-0.1585 1949,-0.1492 1950,-0.1711 1951,-0.1688 1952,-0.1490 1953,-0.1556 1954,-0.1548 1955,-0.1580 1956,-0.1420 1957,-0.1101 1958,-0.1017 1931 -1.57 0.15 1932 1933 0.83 1934 -0.35 1935 0.23 1936 1937 -0.66 0.17 0.56 1938 1939 0.31 1940 0.09 -0.60 1941 1942 -0.51 1943 -0.86 1944 -0.09 1945 1946 -1.19 0.77 -0.72 -0.33 1947 1948 1949 -0.53 1950 0.08 0.73 1951 1952 -0.31 1953 0.26 -1.90 1954 1955 -072 1956 1957 -0.95 -1.12 1.28 1958 NorCal-1880-2018.CSV 38.5 deg N 121.7 deg E Temperature Anomalies July Units: Degrees Celsius Base Period: 1981-2010 Missing: -9999 Year Value 1880 -1.56 1881 -0.08 1882 -0.30 1883 -1.44 -2.29 1884 1885 -1.95 1886 -0.63 1887 1888 1889 0.63 -0.72 2.99 -0.50 -1.36 1.03 1890 1891 1892 1893 1894 1895 1896 1.23 1897 1898 -0.83 -0.91 1.53 1899 1900 1.08 1901 1902 NorCal-1880-2018.csv 1903 -1.10 1904 -0.83 1905 -0.31 1906 1907 -0.22 -1.02 -1.05 1908 1909 -0.65 1910 -0.65 1911 -1.06 1912 -0.65 1913 -2.32 1914 1.12 1915 1916 -0.21 -0.57 1917 0.41 1918 -0.13 1919 0.48 1920 0.67 1921 0.21 1922 0.65 1923 -0.60 1924 -1.00 1925 -1.22 1926 -1.10 -0.03 1927 1928 0.61 1929 0.54 1930 0.66 1958 1.28 1959 1.29 1960 151 0.28 2.33 0.32 -0.25 1962 1963 1954 -0.13 1965 -0.80 1966 0.10 1957 1.23 1968 -0.06 1969 -1.19 1970 -1.51 1971 0.28 1972 -0.15 1973 1.32 1974 -0.72 1975 0.49 1976 -1.43 1977 -1.51 1978 1.61 1979 -0.74 1980 -1.41 1981 -0.09 182 -0.33 1983 -0.88 184 -0.06 1985 0.57 1985 0.57 -0.83 1986 1987 -0.77 1968 -0.21 1989 -0.13 1990 -0.54 191 -0.10 1992 -0.21 1993 -1.80 1994 1.47 1995 -0.08 1996 -1.28 1997 1998 2.20 0.49 -0.37 0.73 1999 2000 2001 0.40 2002 0.15 2003 -1.25 2004 0.03 2005 1.47 2006 -0.39 0.40 2007 2008 0.59 0.41 2009 2010 0.34 2011 -0.22 2012 1.03 2012 1.03 2013 0.23 2014 -0.06 2015 -0.40 2016 0.48 2017 2.63 2018 0.18