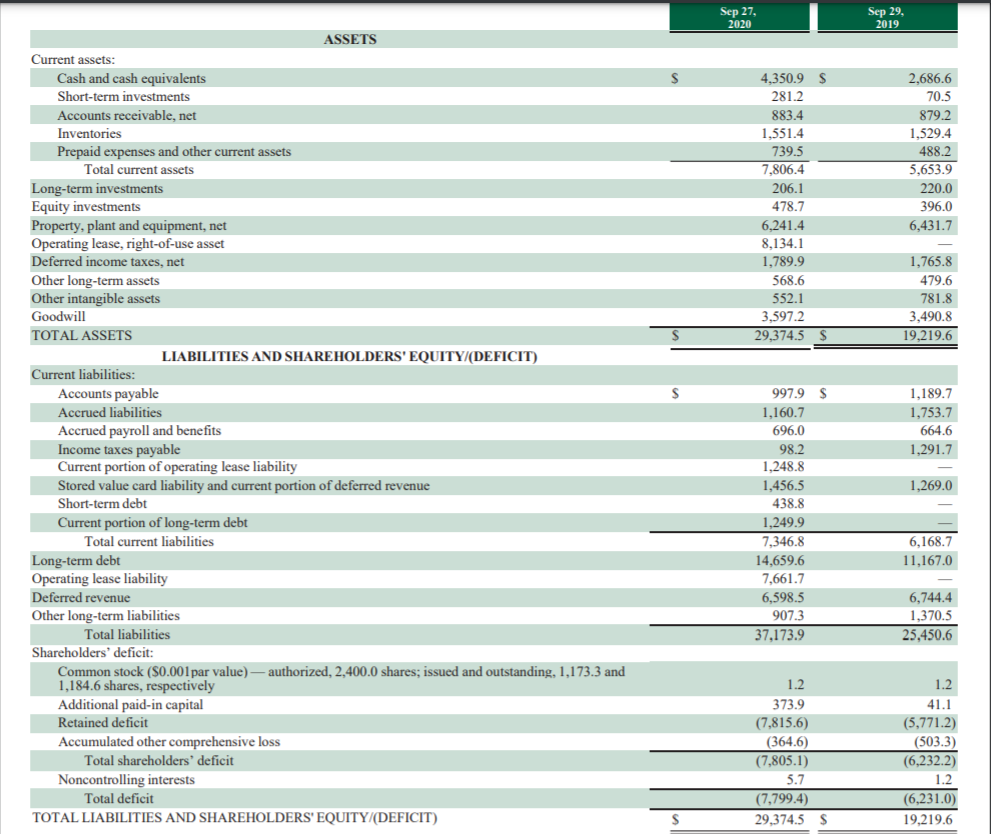
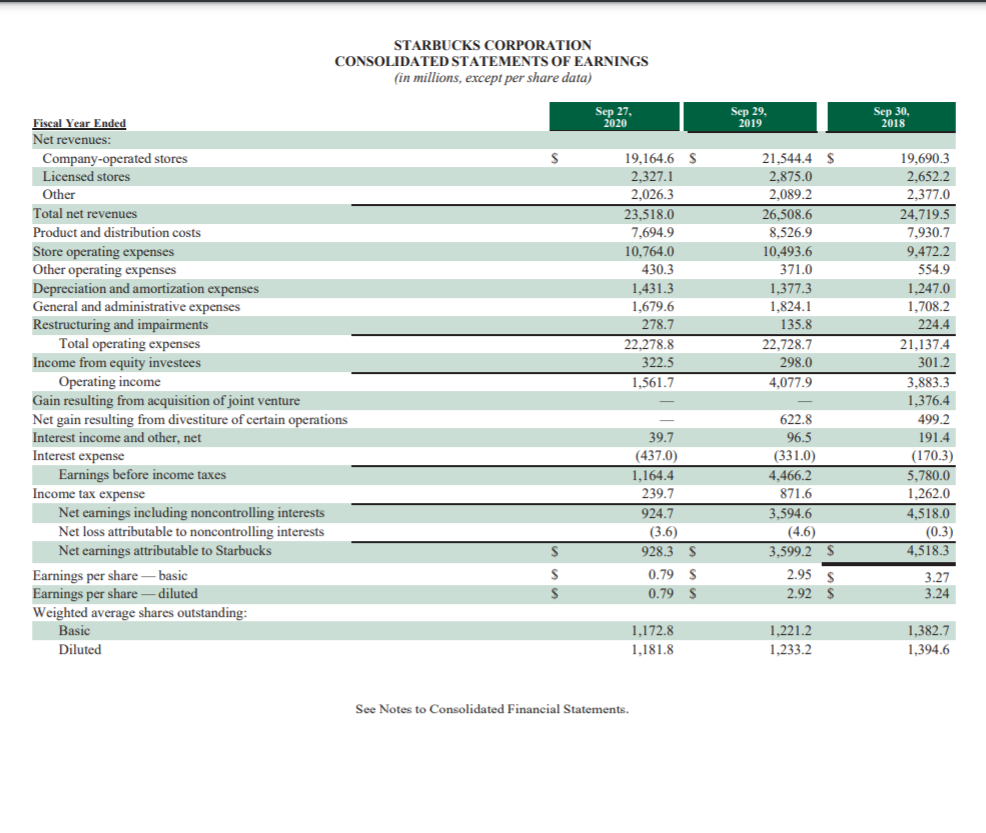
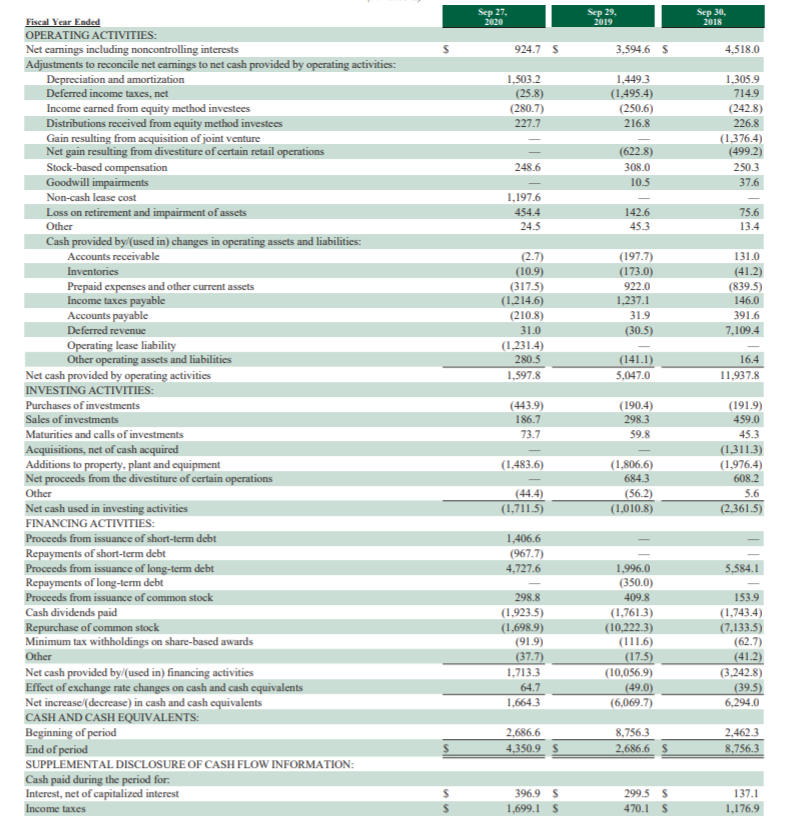
pictures on starbucks are needed for ONLY question 2 (Describe and compare the investing activities for your company from 2019 to 2020 by analyzing the change in their property, plant and equipment on the balance sheet for these years. Make sure to explain how the impact of the Covid-19 pandemic affected your company's investment decisions from 2019 to 2020. Due to the impact of the Covid-19 pandemic, describe if you company increased or decreased its investments in property, plant, and equipment on the balance sheet from 2019 to 2020. b. Describe a new service or product that you would recommend for your company to offer to its customers due to the impact of the COVID-19 pandemic. Explain what new investments in property, plant, and equipment, technology, or new processes or new customer support services would be necessary to offer this new product or service to your customers. Would it benefit your company to make these new investments in property, plant, and equipment, technology, or new processes or new customer support services once the Covid-19 pandemic is over? * Upload and attach your completed excel file to your posting. 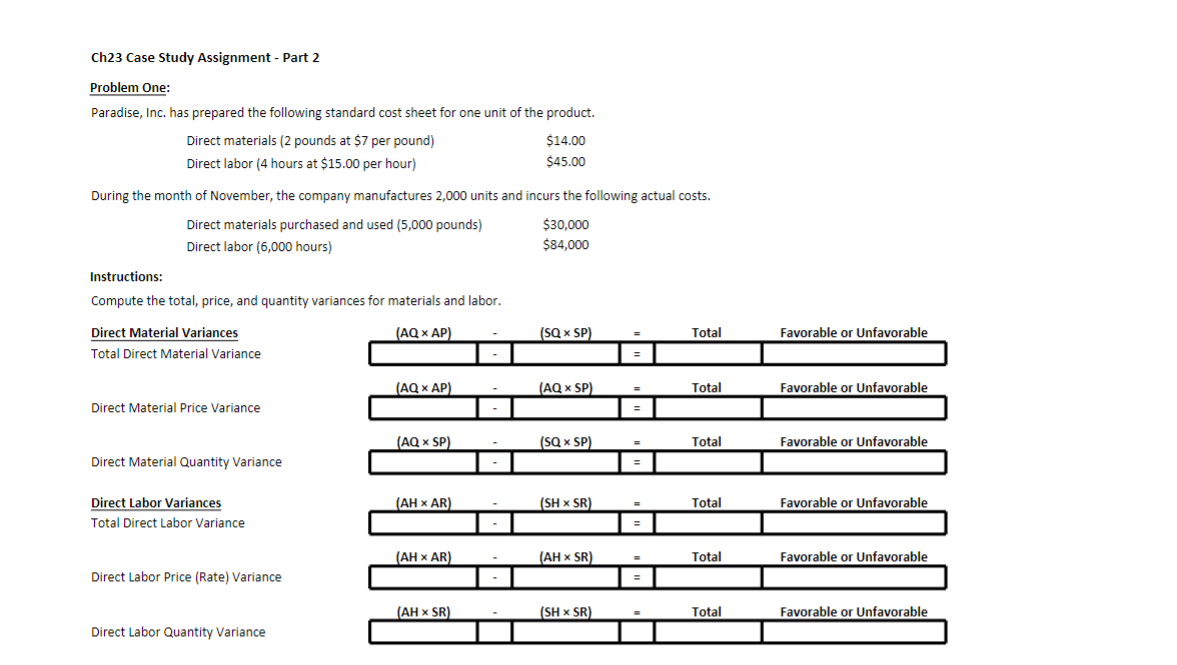
Ch23 Case Study Assignment - Part 2 Problem One: Paradise, Inc. has prepared the following standard cost sheet for one unit of the product. Direct materials (2 pounds at $7 per pound) $14.00 Direct labor (4 hours at $15.00 per hour) $45.00 During the month of November, the company manufactures 2,000 units and incurs the following actual costs. Direct materials purchased and used (5,000 pounds) $30,000 Direct labor (6,000 hours) $84,000 Instructions: Compute the total, price, and quantity variances for materials and labor. (AQ X AP) (SQ SP) Total Favorable or Unfavorable Direct Material Variances Total Direct Material Variance (AQ X AP) (AQ SP) Total Favorable or Unfavorable Direct Material Price Variance (AQ x SP) (SQ x SP) Total Favorable or Unfavorable Direct Material Quantity Variance (AH XAR) (SHX SR) Total Favorable or Unfavorable Direct Labor Variances Total Direct Labor Variance (AHAR) (AHX SR) Total Favorable or Unfavorable Direct Labor Price (Rate) Variance (AH SR) (SH X SR) Total Favorable or Unfavorable Direct Labor Quantity Variance Sep 27, 2020 Sep 29, 2019 4,350.9 S 281.2 883.4 1,551.4 739.5 7,806.4 206.1 478.7 6,241.4 8.134.1 1.789.9 568.6 552.1 3,597.2 29,374.5 $ 2,686.6 70.5 879.2 1,529.4 488.2 5,653.9 220.0 396.0 6,431.7 1,765.8 479.6 781.8 3.490,8 19,219.6 S ASSETS Current assets: Cash and cash equivalents Short-term investments Accounts receivable, net Inventories Prepaid expenses and other current assets Total current assets Long-term investments Equity investments Property, plant and equipment, net Operating lease, right-of-use asset Deferred income taxes, net Other long-term assets Other intangible assets Goodwill TOTAL ASSETS LIABILITIES AND SHAREHOLDERS' EQUITY/(DEFICIT) Current liabilities: Accounts payable Accrued liabilities Accrued payroll and benefits Income taxes payable Current portion of operating lease liability Stored value card liability and current portion of deferred revenue Short-term debt Current portion of long-term debt Total current liabilities Long-term debt Operating lease liability Deferred revenue Other long-term liabilities Total liabilities Shareholders' deficit: Common stock (S0.001 par value) - authorized, 2,400.0 shares, issued and outstanding, 1,173.3 and 1,184.6 shares, respectively Additional paid-in capital Retained deficit Accumulated other comprehensive loss Total shareholders' deficit Noncontrolling interests Total deficit TOTAL LIABILITIES AND SHAREHOLDERS' EQUITY/(DEFICIT) 1,189.7 1,753.7 664.6 1,291.7 1,269.0 997.9 $ 1,160.7 696.0 98.2 1,248.8 1,456.5 438.8 1,249.9 7,346.8 14.659.6 7,661.7 6,598.5 907.3 37,173.9 6,168.7 11,167.0 6,744.4 1,370.5 25,450.6 1.2 373.9 (7,815.6) (364.6) (7,805.1) 5.7 (7,799.4) 29,374.5 $ 1.2 41.1 (5,771.2) (503.3) (6.232.2) 1.2 (6,231.0) 19,219.6 STARBUCKS CORPORATION CONSOLIDATED STATEMENTS OF EARNINGS (in millions, except per share data) Sep 27 2020 Sep 29, 2019 Sep 30, 2018 S Fiscal Year Ended Net revenues: Company-operated stores Licensed stores Other Total net revenues Product and distribution costs Store operating expenses Other operating expenses Depreciation and amortization expenses General and administrative expenses Restructuring and impairments Total operating expenses Income from equity investees Operating income Gain resulting from acquisition of joint venture Net gain resulting from divestiture of certain operations Interest income and other, net Interest expense Earnings before income taxes Income tax expense Net eamings including noncontrolling interests Net loss attributable to noncontrolling interests Net earnings attributable to Starbucks Earnings per share-basic Earnings per share-diluted Weighted average shares outstanding: Basic Diluted 19,164.6 S 2,327.1 2,026.3 23,518.0 7,694.9 10,764.0 430.3 1,431.3 1,679.6 278.7 22.278.8 322.5 1.561.7 21,544.4 $ 2,875.0 2.089.2 26.508.6 8,526.9 10,493.6 371.0 1,377.3 1,824.1 135.8 22,728.7 298.0 4,077.9 19,690.3 2,652.2 2,377.0 24.719.5 7,930.7 9,472.2 554.9 1,247.0 1,708.2 224.4 21,137.4 301.2 3,883.3 1,376.4 499.2 191.4 (170.3) 5,780.0 1,262.0 4,518.0 39.7 (437.0) 1,164.4 239.7 924.7 622.8 96.5 (331.0) 4,466.2 871.6 3.594.6 (4.6) 3,599.2 S 2.95 S 292 S (3.6) (0.3) S 4,518.3 S 928.3 S 0.79 s 0.79S 3.27 3.24 S 1,172.8 1,181.8 1.221.2 1.233.2 1,382.7 1,394.6 See Notes to Consolidated Financial Statements. Sep 27, 2020 Sep 29. 2019 Sep 30 2018 s 924.7 S 3.594.6 S 4.518.0 1,5032 (25.8) (2807) 227.7 1,449.3 (1.495.4) (250.6) 216.8 1.305.9 714.9 (242.8) 226.8 (1.376.4) (499.2) 250.3 37.6 248.6 (622.8) 308.0 10.5 1,197.6 454.4 24.5 142.6 45.3 75.6 13.4 (2.7) (10.9) (317.5) (1,214.6) (210.8) 31.0 (1,231.4) 280.5 1.597.8 (197.7) (173.0) 922.0 1.237.1 31.9 (30.5) 131.0 (41.2) (839.5) 146.0 391.6 7,109.4 (141.1) 5,047.0 16.4 11,937.8 Fiscal Year Ended OPERATING ACTIVITIES: Net earnings including noncontrolling interests Adjustments to reconcile net camings to net cash provided by operating activities: Depreciation and amortization Deferred income taxes, net Income earned from equity method investees Distributions received from equity method investees Gain resulting from acquisition of joint venture Net gain resulting from divestiture of certain retail operations Stock-based compensation Goodwill impairments Non-cash lease cost Loss on retirement and impairment of assets Other Cash provided by (used in) changes in operating assets and liabilities: Accounts receivable Inventories Prepaid expenses and other current assets Income taxes payable Accounts payable Deferred revenue Operating lease liability Other operating assets and liabilities Net cash provided by operating activities INVESTING ACTIVITIES: Purchases of investments Sales of investments Maturities and calls of investments Acquisitions, net of cash acquired Additions to property, plant and equipment Net proceeds from the divestiture of certain operations Other Net cash used in investing activities FINANCING ACTIVITIES: Proceeds from issuance of short-term debt Repayments of short-term debt Proceeds from issuance of long-term debt Repayments of long-term debt Proceeds from issuance of common stock Cash dividends paid Repurchase of common stock Minimum tax withholdings on share-based awards Other Net cash provided by/(used in) financing activities Effect of exchange rate changes on cash and cash equivalents Net increase (decrease) in cash and cash equivalents CASH AND CASH EQUIVALENTS: Beginning of period End of period SUPPLEMENTAL DISCLOSURE OF CASH FLOW INFORMATION: Cash paid during the period for Interest, net of capitalized interest (443.9) 186,7 73.7 (190.4) 2983 59.8 (1,483.6) (191.9) 459.0 45.3 (1.311.3) (1,976.4) 608.2 5.6 (2,361.5) (1.806.6) 684.3 (56.2) (1,010.8) (44.4) (1,711.5) 1,406.6 (967.7) 4,727.6 5,584.1 298.8 (1,923.5) (1,698.9) (91.9) (37.7) 1.713.3 64.7 1,664.3 1.996.0 (350.0) 409.8 (1,761.3) (10,222.3) (1116) (17.5) (10,056.9) (49.0) (6,069.7) 153.9 (1,743.4) (7,133.5) (62.7) (41.2) (3,242.8) (39.5 6,294.0 2.686.6 4.350.9 s 8,756.3 2.686.65 2.462.3 8,756.3 396,9 s 1,699.1 S 299.5 5 470.1 S 137.1 1,176.9 Income taxes