

Answered step by step
Verified Expert Solution
Question
1 Approved Answer
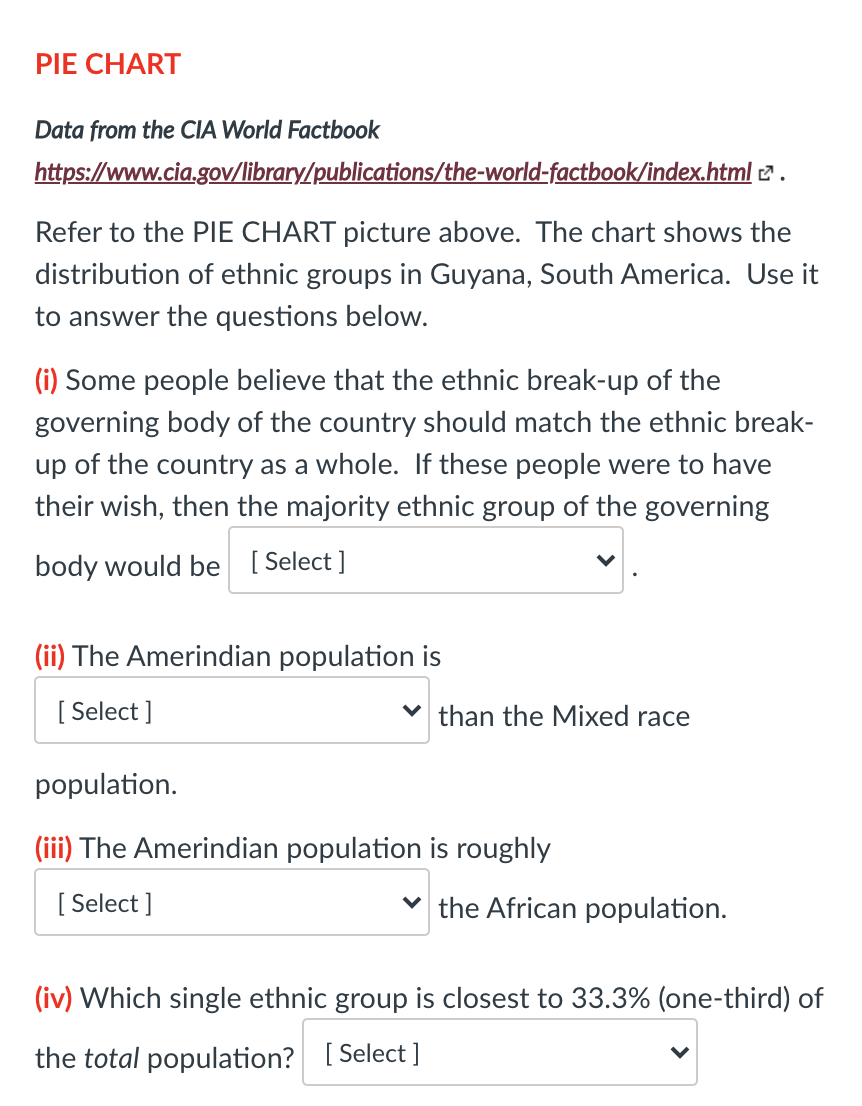
PIE CHART Data from the CIA World Factbook https://www.cia.gov/library/publications/the-world-factbook/index.html z . Refer to the PIE CHART picture above. The chart shows the distribution of ethnic
Step by Step Solution
There are 3 Steps involved in it
Step: 1

Get Instant Access to Expert-Tailored Solutions
See step-by-step solutions with expert insights and AI powered tools for academic success
Step: 2

Step: 3
Ace Your Homework with AI
Get the answers you need in no time with our AI-driven, step-by-step assistance
Get Started
Elementary Algebra Graphs & Authentic Applications (Subscription)
Authors: Jay Lehmann
3rd Edition
0134781252, 9780134781259