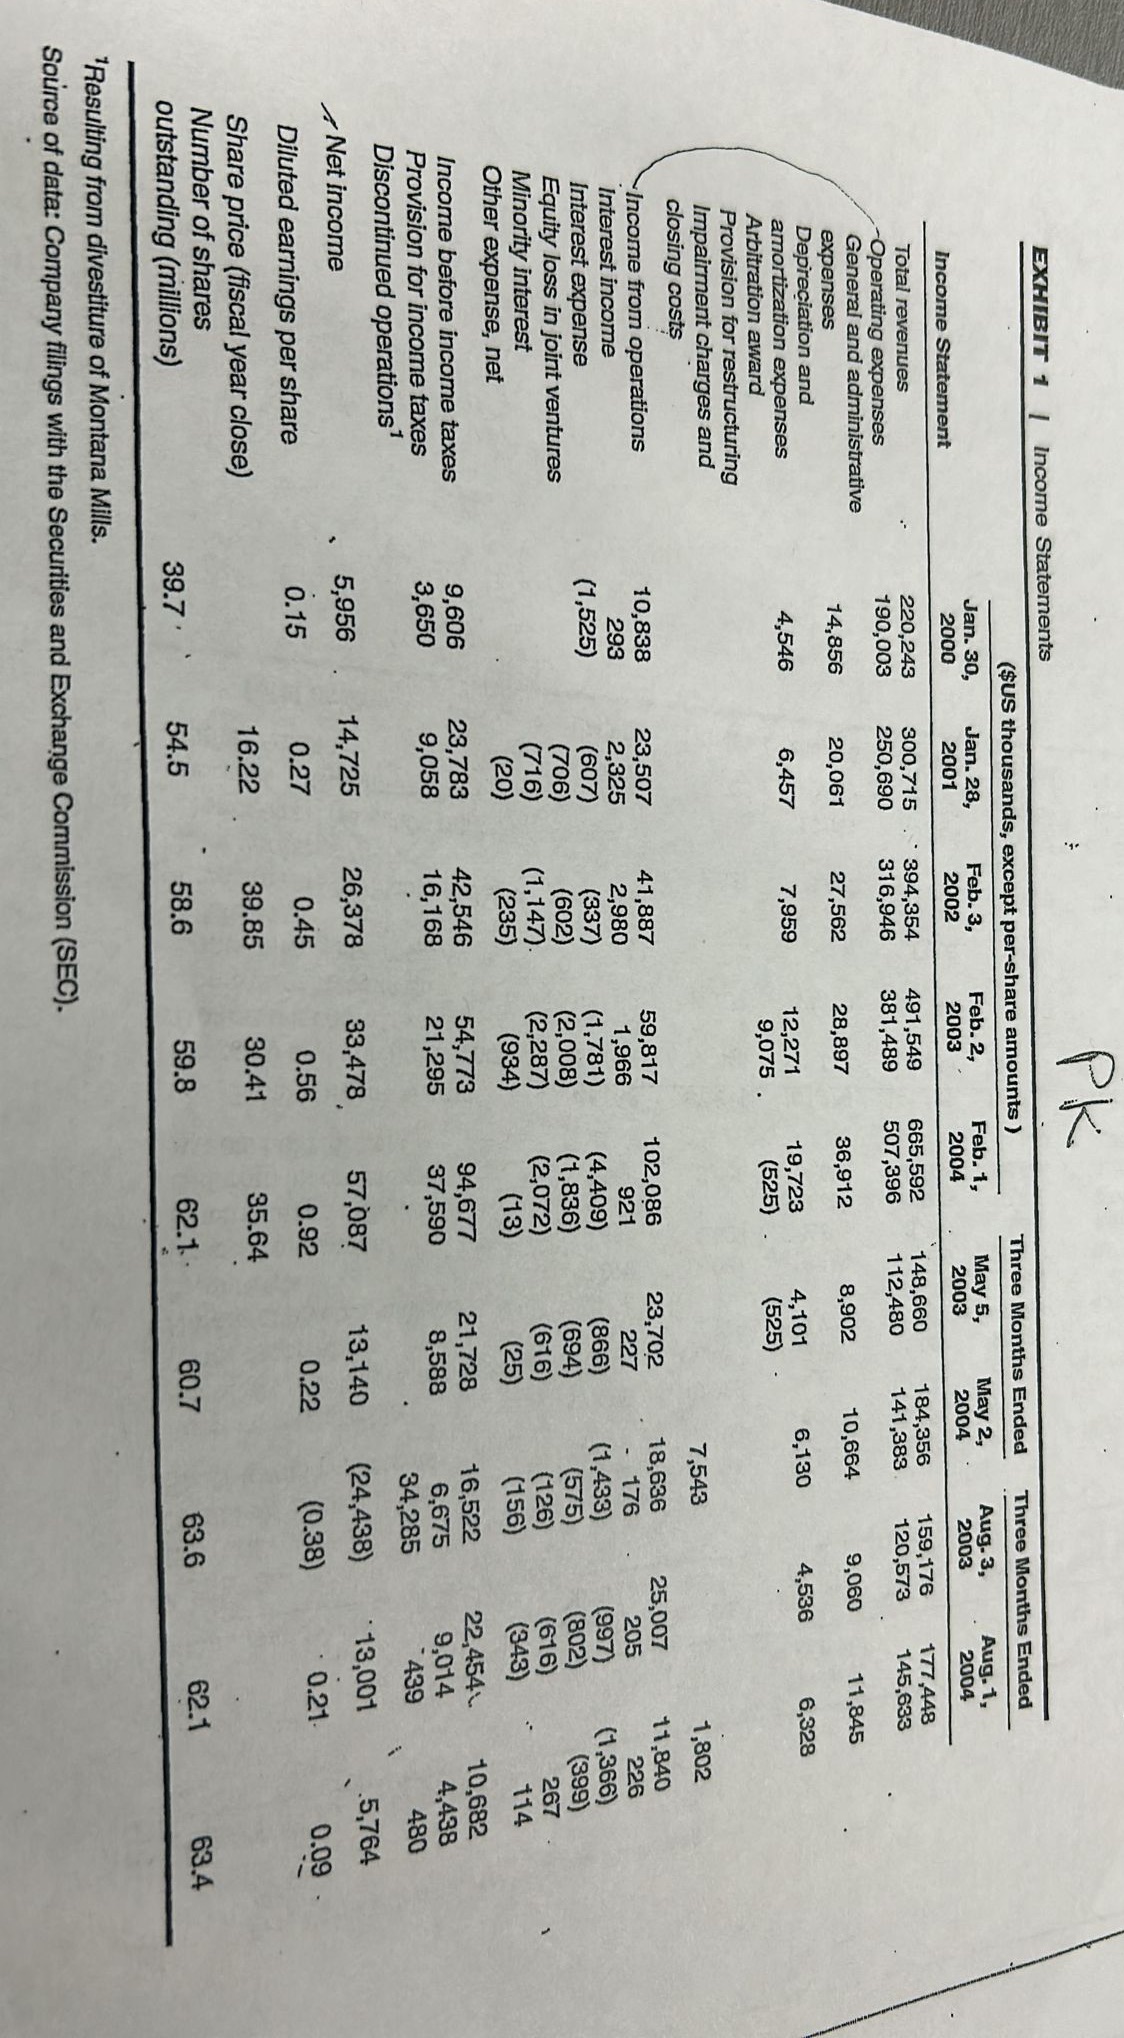
PK EXHIBIT 1 | Income Statements ($US thousands, except per-share amounts ) Three Months Ended Three Months Ended Jan. 30, Jan. 28, Feb. 3, Feb. 2, Feb. 1, May 5, May 2, Aug. 3, Aug. 1, Income Statement 2000 2001 2002 2003 2004 2003 2004 2003 2004 Total revenues 220,243 300,715 394,354 491,549 665,592 148,660 184,356 159,176 177,448 Operating expenses 190,003 250,690 316,946 381,489 507,396 112,480 141,383 120,573 145,633 General and administrative expenses 14,856 20,061 27,562 28,897 36,912 8,902 10,664 9,060 11,845 Depreciation and amortization expenses 4,546 6,457 7,959 12,271 19,723 4,101 6,130 4,536 6,328 Arbitration award 9,075 . (525) (525) Provision for restructuring Impairment charges and closing costs 7,543 1,802 Income from operations 10,838 23,507 41,887 59,817 102,086 23,702 18,636 25,007 11,840 Interest income 293 2,325 2,980 1,966 921 227 176 205 226 Interest expense (1,525) (607) (337) (1,781) (4,409) (866) (1,433) (997) (1,366) Equity loss in joint ventures (706) (602) (2,008) (1,836) (694) (575) (802) (399) Minority interest (716) (1,147) (2,287) (2,072) (616) (126) (616) 267 Other expense, net (20) (235) (934) (13) (25) (156) (343) 114 Income before income taxes 9,606 23,783 42,546 54,773 94,677 21,728 16,522 22,454 10,682 Provision for income taxes 3,650 9,058 16, 168 21,295 37,590 8,588 6,675 9,014 4,438 Discontinued operations 34,285 439 480 Net income 5,956 14,725 26,378 33,478 57,087 13,140 (24,438) . 13,001 .5,764 Diluted earnings per share 0.15 0.27 0.45 0.56 0.92 0.22 (0.38) 0.21. 0.09 Share price (fiscal year close) 16.22 39.85 30.41 35.64 Number of shares outstanding (millions) 39.7 . 54.5 58.6 59.8 62.1 60.7 63.6 62.1 63.4 1Resulting from divestiture of Montana Mills. Source of data: Company filings with the Securities and Exchange Commission (SEC)