Answered step by step
Verified Expert Solution
Question
1 Approved Answer
Place all your coding work for this question in the lab notebook template and your project report in the TMA word processing template. In


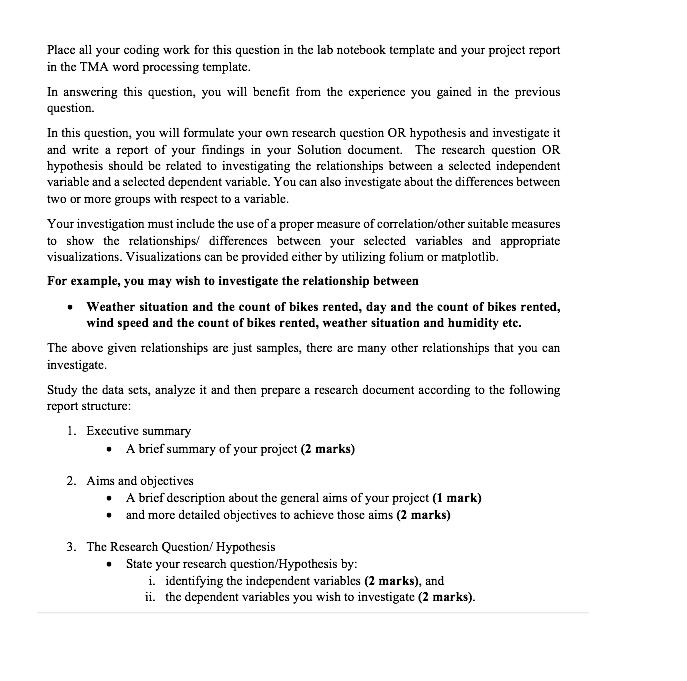
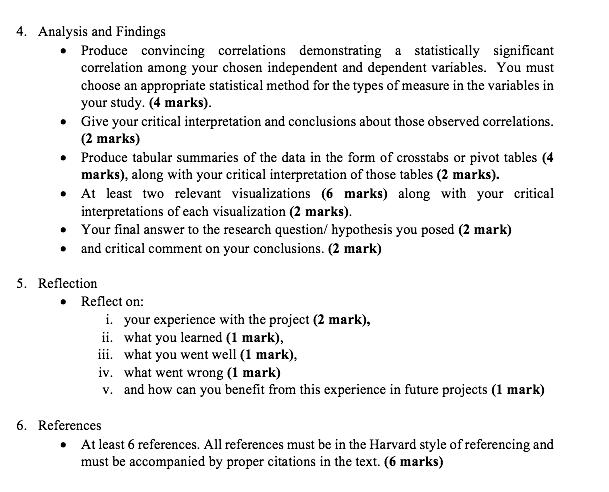
Place all your coding work for this question in the lab notebook template and your project report in the TMA word processing template. In answering this question, you will benefit from the experience you gained in the previous question. In this question, you will formulate your own research question OR hypothesis and investigate it and write a report of your findings in your Solution document. The research question OR hypothesis should be related to investigating the relationships between a selected independent variable and a selected dependent variable. You can also investigate about the differences between two or more groups with respect to a variable. Your investigation must include the use of a proper measure of correlation/other suitable measures to show the relationships/ differences between your selected variables and appropriate visualizations. Visualizations can be provided either by utilizing folium or matplotlib. For example, you may wish to investigate the relationship between Weather situation and the count of bikes rented, day and the count of bikes rented, wind speed and the count of bikes rented, weather situation and humidity etc. The above given relationships are just samples, there are many other relationships that you can investigate. Study the data sets, analyze it and then prepare a research document according to the following report structure: 1. Executive summary A brief summary of your project (2 marks) 2. Aims and objectives A brief description about the general aims of your project (1 mark) and more detailed objectives to achieve those aims (2 marks) 3. The Research Question/ Hypothesis State your research question/Hypothesis by: i. identifying the independent variables (2 marks), and ii. the dependent variables you wish to investigate (2 marks). 4. Analysis and Findings Produce convincing correlations demonstrating a statistically significant correlation among your chosen independent and dependent variables. You must choose an appropriate statistical method for the types of measure in the variables in your study. (4 marks). Give your critical interpretation and conclusions about those observed correlations. (2 marks) Produce tabular summaries of the data in the form of crosstabs or pivot tables (4 marks), along with your critical interpretation of those tables (2 marks). At least two relevant visualizations (6 marks) along with your critical interpretations of each visualization (2 marks). Your final answer to the research question/ hypothesis you posed (2 mark) and critical comment on your conclusions. (2 mark) 5. Reflection Reflect on: i. your experience with the project (2 mark), ii. what you learned (1 mark), iii. what you went well (1 mark), iv. what went wrong (1 mark) v. and how can you benefit from this experience in future projects (1 mark) 6. References At least 6 references. All references must be in the Harvard style of referencing and must be accompanied by proper citations in the text. (6 marks)
Step by Step Solution
★★★★★
3.34 Rating (157 Votes )
There are 3 Steps involved in it
Step: 1
Executive Summary This project investigated the relationship between ...
Get Instant Access to Expert-Tailored Solutions
See step-by-step solutions with expert insights and AI powered tools for academic success
Step: 2

Step: 3

Ace Your Homework with AI
Get the answers you need in no time with our AI-driven, step-by-step assistance
Get Started


