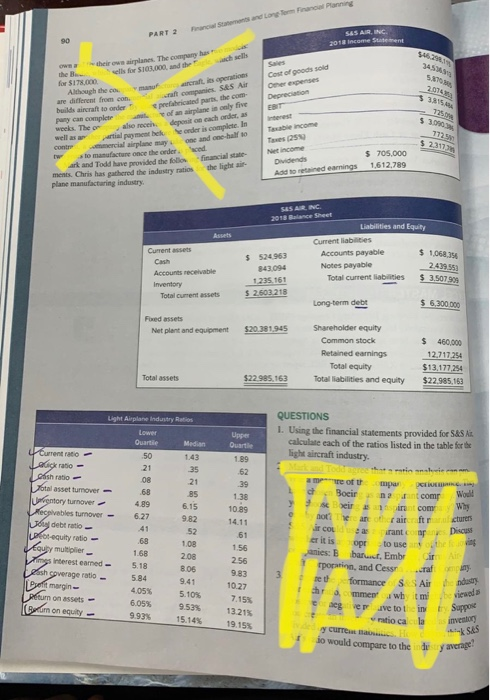
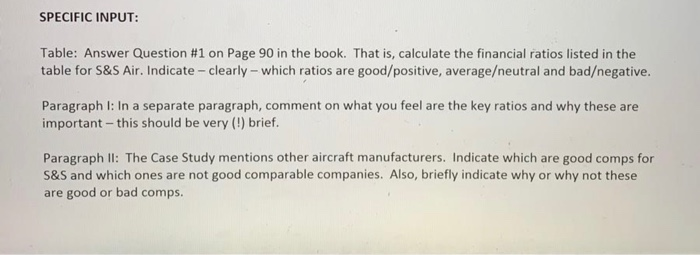
pleaaaz i need help answering the three questions on the second photo. please thank you!

lo would compare to the traverse Frances and Logo Farol Planning PART 2 90 SAS AIR, INC 2018 Income Statement 345 -hows planes. The company has ells for S103.000, and the whole Cost of goods sold Omer expenses Depreciation 2014 at companies. S&S Air prefabricated parts, the com of an airplane is only five deposito cach order, as the for $17.000 Although the are different from con builds aircraft to order pany can complet weeks. The or ao roce payment order is complete. In Cont mercial airplane my to manufacture once the ordered ark and Todd have provided the follo ment. Chris has gathered the industry ratios plane manufacturing industry $ 3.000 1729 $ 2311 e and one ballo Nincome Dividends Add to retained earnings $ 705.000 1,612,789 SESAR.INC 2013 Bilance Sheet Current assets Ca Accounts receivable Inventory Total current assets $ 524963 843 094 1.235.161 $ 2603 218 Liabilities and Equity Current liabilities Accounts payable Notes payable Total current liabilities $ 1,068,394 242952 $ 3.5079 Long-term debt $ 6,300 000 Fixed assets Net plant and equipment $20 381.945 Shareholder equity Common stock Retained earnings Total equity Total abilities and equity $ 460,000 12,717 254 $13,177,254 $22.985.163 Total assets $22.985.163 Light Airplane Industry Ratio Lower Quartie 50 21 08 .68 4.89 6.27 Current ratio Ladisk ratio- Ofis ratio otal asset turnover - Umientory turnover Receivables turnover - og debt ratio Lot-equity ratio- awy multiplier nos interest earned - ash soverage ratio De margin- poumon assets - Cum on equity - Median 1.43 35 21 85 6.15 9.82 52 1.08 2.08 8.06 9.41 5.10% 953% 15.14% Quartie 1.89 .62 39 1.38 10.89 14.11 61 cturers QUESTIONS 1. Using the financial statements provided for S&S calculate each of the ratios listed in the table for the Light aircraft industry This pe of mpar 1 Bocir2 Would Income com Why not an airftr ir cox urante un Discus er it is opr to use anies: Ebart, Embr rporatinn, and Cesar 3 formance S Air mmea whimi e seg Je to in ratio cala 156 2.56 .68 1.68 5.18 584 4.05% 9.83 10.27 7.15% 13.21% 19.15% industry . views Suppose 6.05% 9.93% y curreal SES SPECIFIC INPUT: Table: Answer Question #1 on Page 90 in the book. That is, calculate the financial ratios listed in the table for S&S Air Indicate - clearly which ratios are good/positive, averageeutral and badegative. Paragraph 1: In a separate paragraph, comment on what you feel are the key ratios and why these are important - this should be very (!) brief. Paragraph II: The Case Study mentions other aircraft manufacturers. Indicate which are good comps for S&S and which ones are not good comparable companies. Also, briefly indicate why or why not these are good or bad comps


