Please also include on each of them the linear correlation coefficient, null and hypothesis (H0&H1), Test statistics, P-value. Homework: Hw 10.1 Question 10, 10.1.17-T HW
Please also include on each of them the linear correlation coefficient, null and hypothesis (H0&H1), Test statistics, P-value.
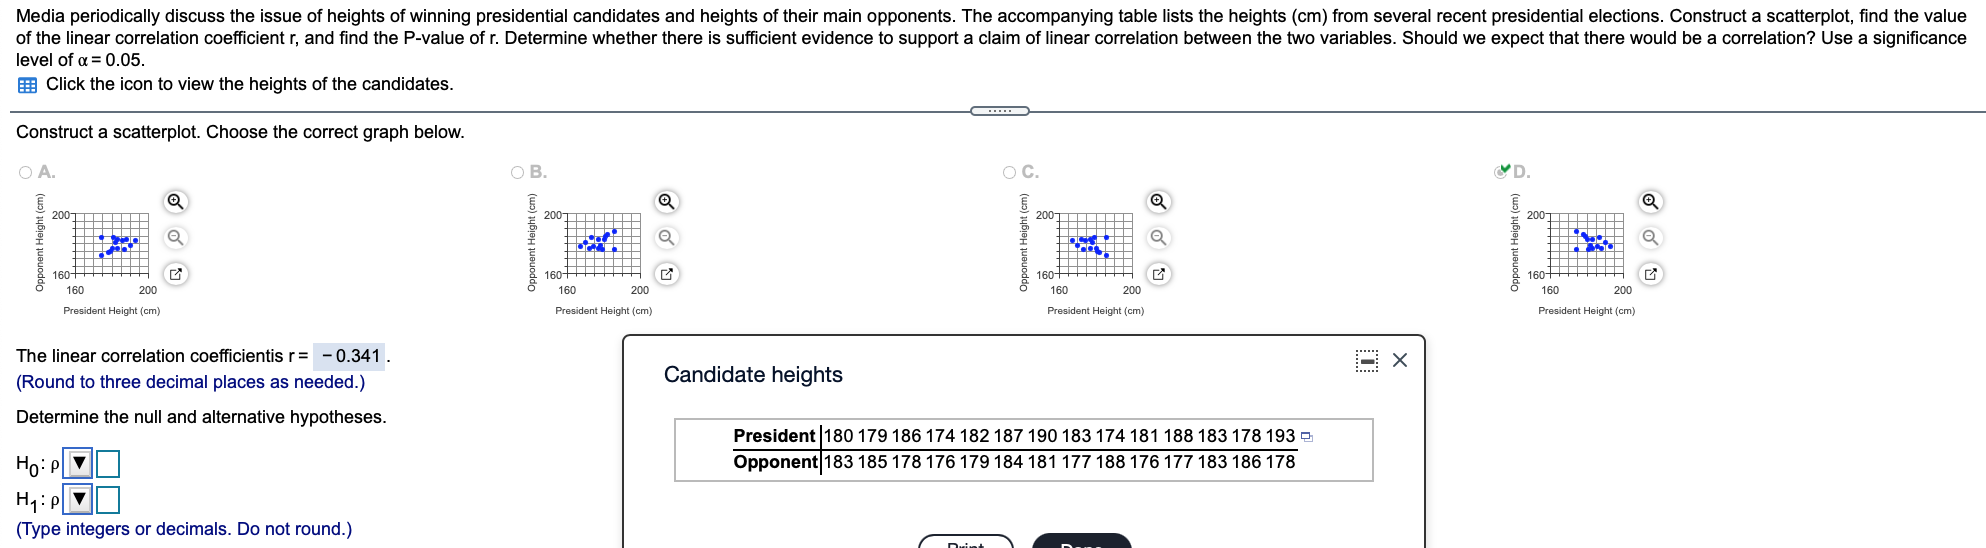
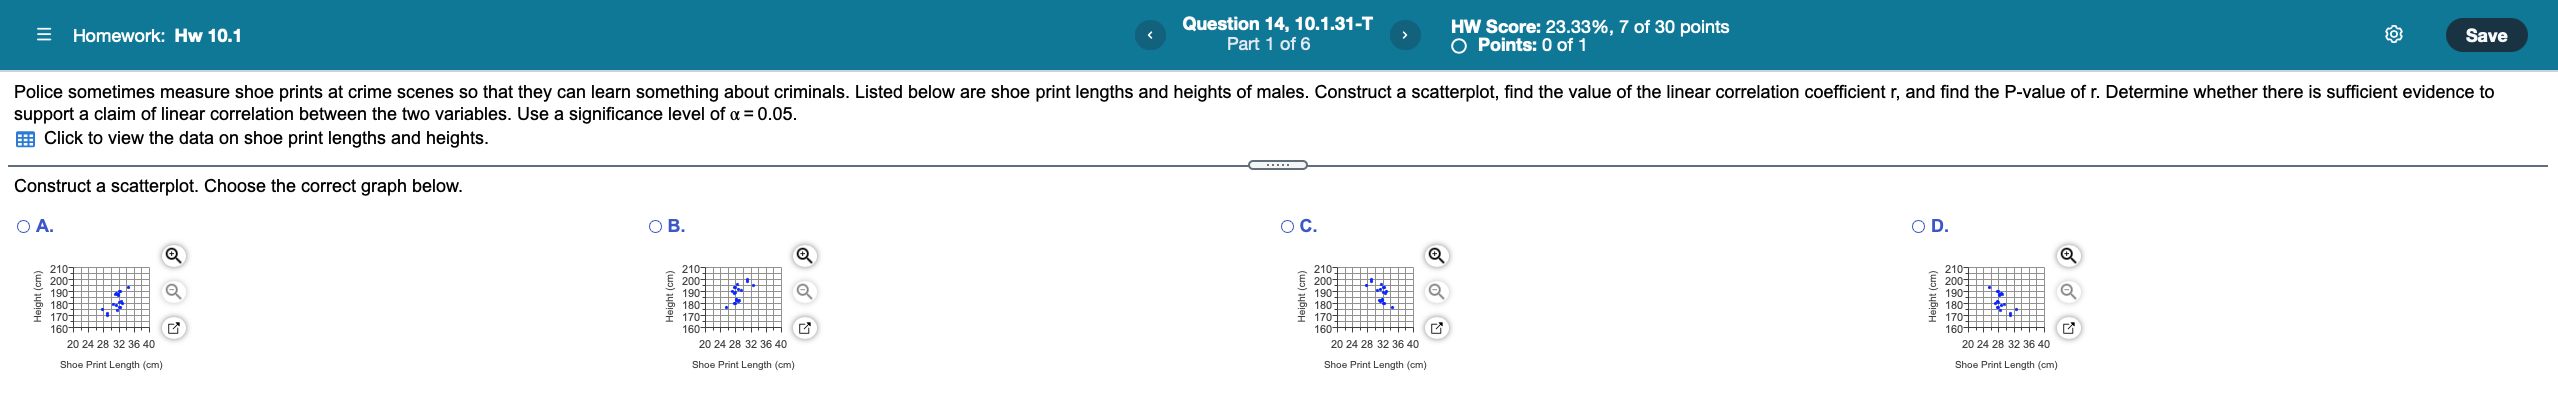
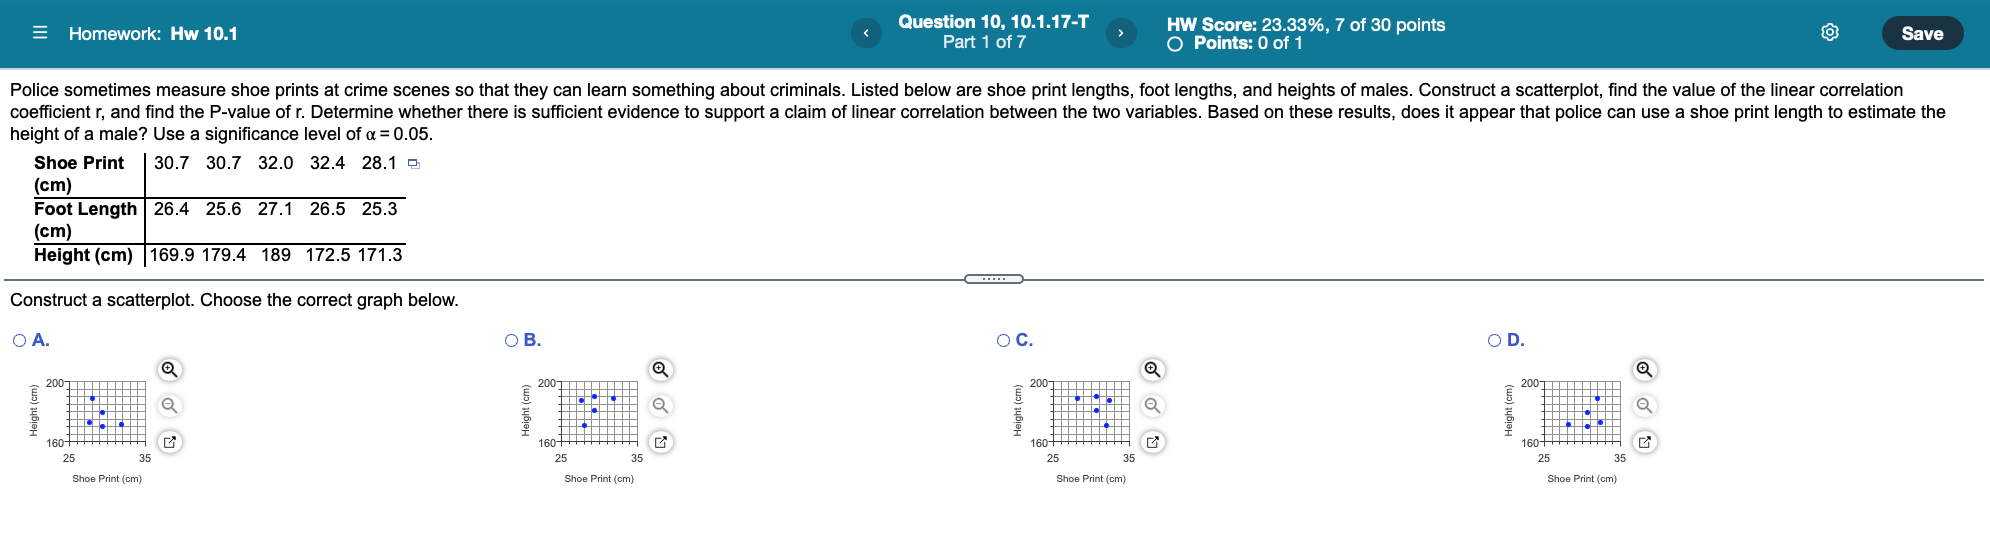
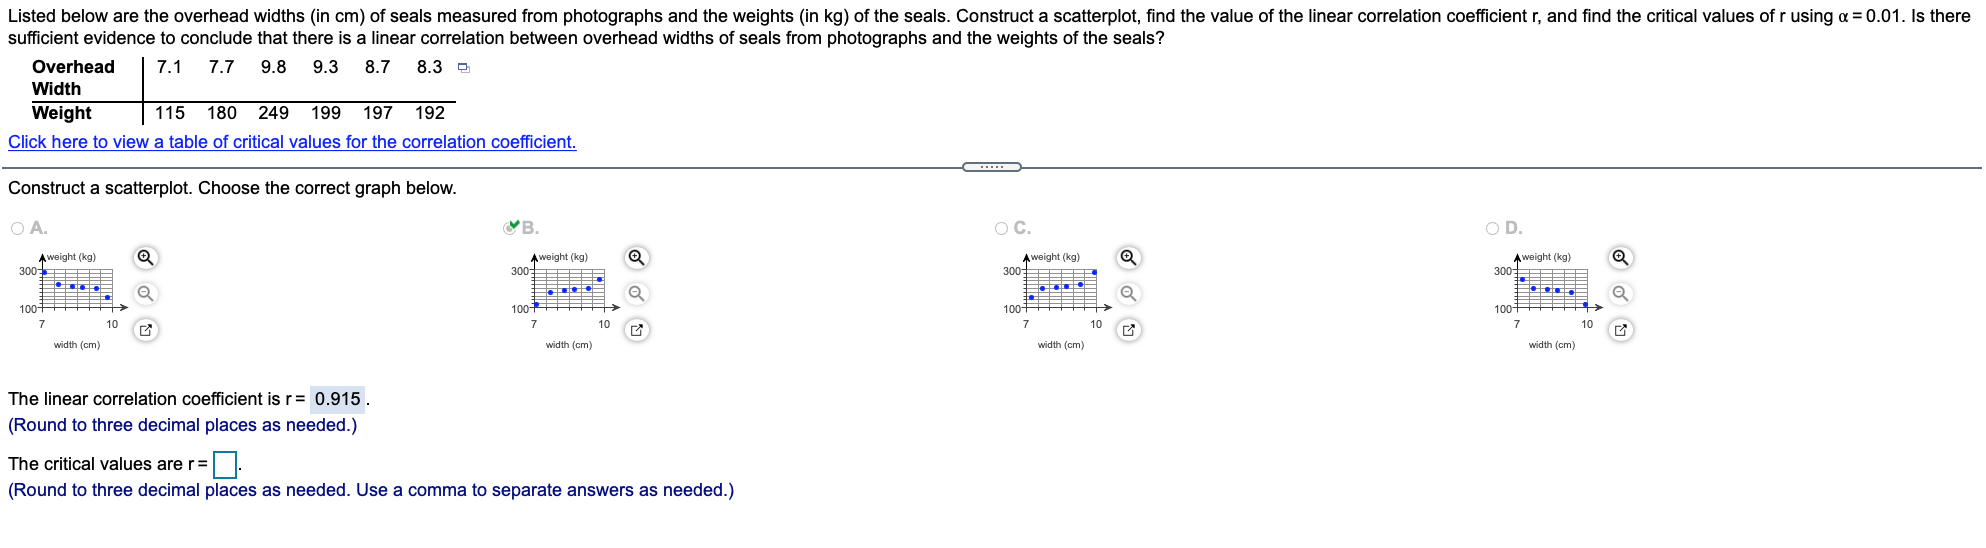
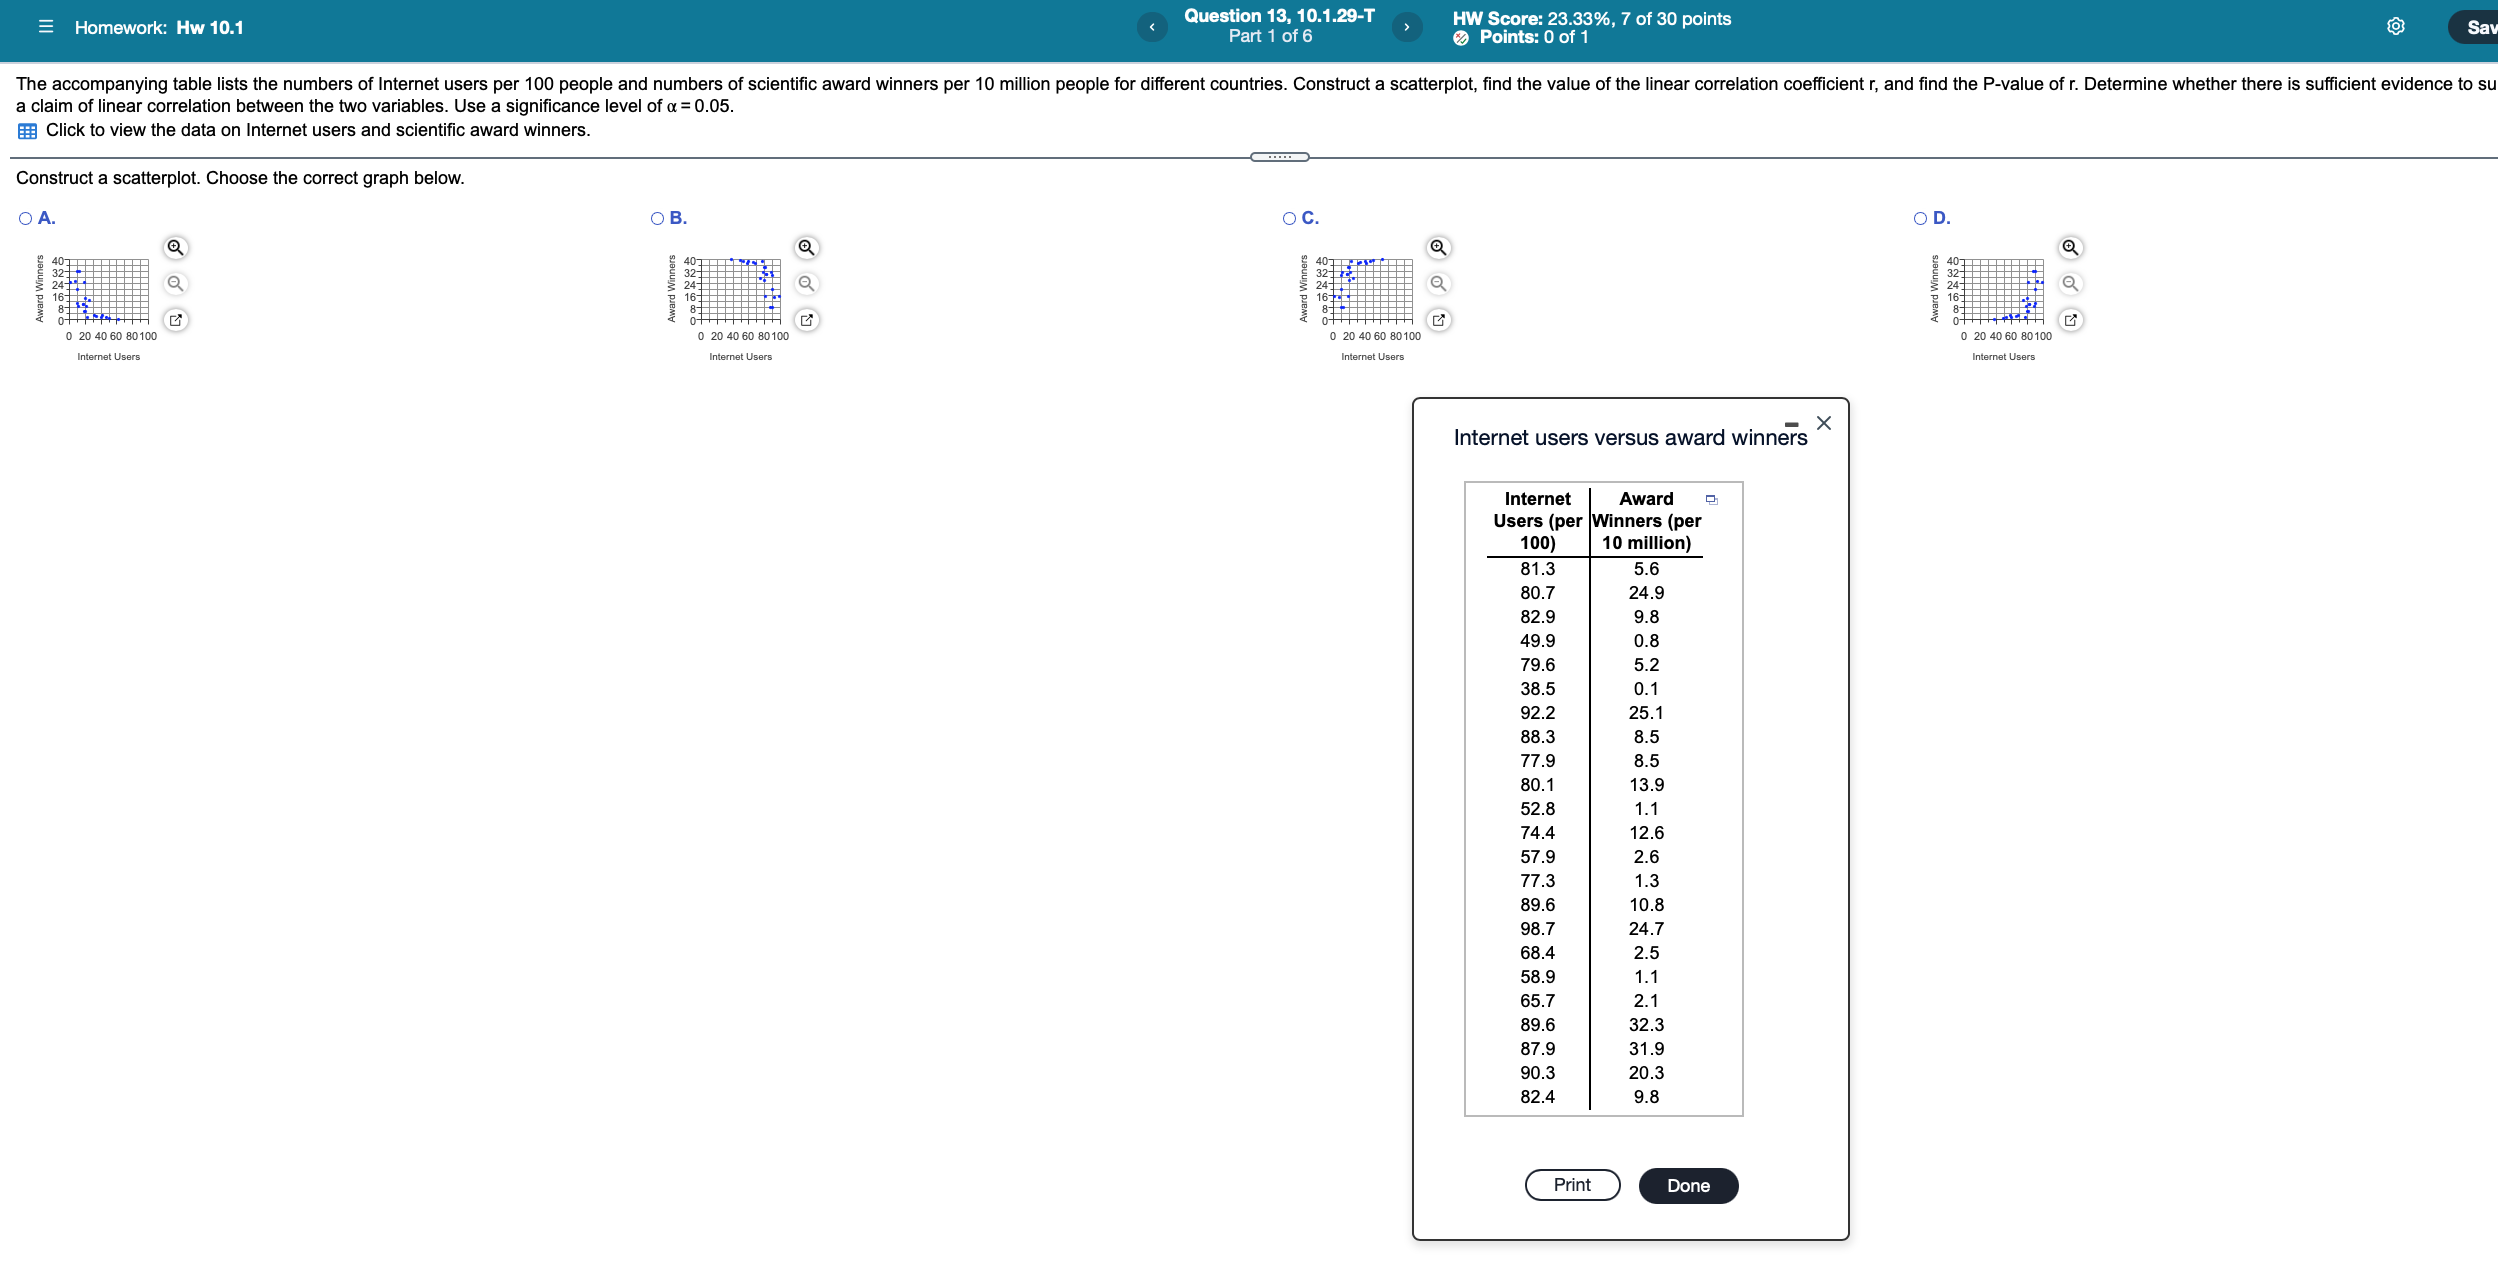
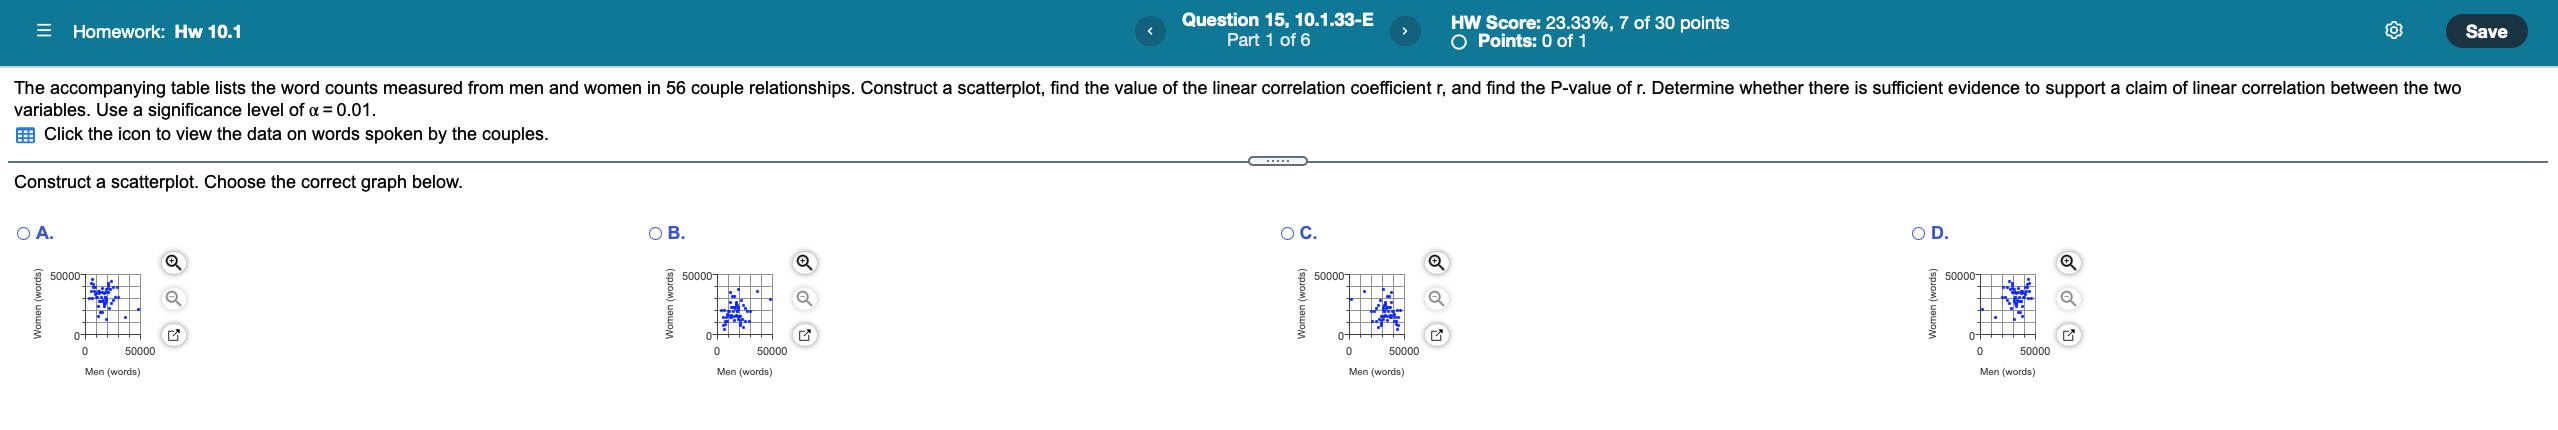
Homework: Hw 10.1 Question 10, 10.1.17-T HW Score: 23.33%, 7 of 30 points Part 1 of 7 O Points: 0 of 1 Save Police sometimes measure shoe prints at crime scenes so that they can learn something about criminals. Listed below are shoe print lengths, foot lengths, and heights of males. Construct a scatterplot, find the value of the linear correlation coefficient r, and find the P-value of r. Determine whether there is sufficient evidence to support a claim of linear correlation between the two variables. Based on these results, does it appear that police can use a shoe print length to estimate the height of a male? Use a significance level of a = 0.05. Shoe Print |30.7 30.7 32.0 32.4 28.1 (cm Foot Length | 26.4 25.6 27.1 26.5 25.3 (cm) Height (cm) 169.9 179.4 189 172.5 171.3 Construct a scatterplot. Choose the correct graph below. O A. OB. OC. OD 200 2007 2007 O O Height (cm) Height (cm) Height (cm) Height (cm) 160 HHHH 60HHHHHH 60 25 35 35 35 Shoe Print (cm) Shoe Print (cm) Shoe Print (cm) Shoe Print (cm)Listed below are the overhead widths (in cm) of seals measured from photographs and the weights (in kg) of the seals. Construct a scatterplot, find the value of the linear correlation coefficient r, and find the critical values of r using a = 0.01. Is there sufficient evidence to conclude that there is a linear correlation between overhead widths of seals from photographs and the weights of the seals? Overhead 7.1 7.7 9.8 9.3 8.7 8.3 5 Width Weight 115 180 249 199 197 192 Click here to view a table of critical values for the correlation coefficient. Construct a scatterplot. Choose the correct graph below. O A. B. OC. OD. A weight (kg) Aweight (kg) A weight (kg) A weight (kg) 300 300 300 300 1007 100 100 100 10 7 10 7 7 10 width (cm) width (cm) width (cm) width (cm) The linear correlation coefficient is r = 0.915 (Round to three decimal places as needed.) The critical values are r=]. Round to three decimal places as needed. Use a comma to separate answers as needed.)Media periodically discuss the issue of heights of winning presidential candidates and heights of their main opponents. The accompanying table lists the heights (cm) from several recent presidential elections. Construct a scatterplot, find the value of the linear correlation coefficient r, and find the P-value of r. Determine whether there is sufficient evidence to support a claim of linear correlation between the two variables. Should we expect that there would be a correlation? Use a significance level of a = 0.05. Click the icon to view the heights of the candidates. Construct a scatterplot. Choose the correct graph below. O A. OB. OC. &D. Q Q Q 200 200 200 Opponent Height (cm) Opponent Height (cm) Opponent Height (cm) Opponent Height ( 160 160H 160 200 160 200 200 160 200 President Height (cm) President Height (cm) President Height (cm) President Height (cm) The linear correlation coefficientis r= - 0.341 . X (Round to three decimal places as needed.) Candidate heights Determine the null and alternative hypotheses. President 180 179 186 174 182 187 190 183 174 181 188 183 178 193 - Ho: PV Opponent 183 185 178 176 179 184 181 177 188 176 177 183 186 178 H1 : P V (Type integers or decimals. Do not round.)Question 13, 10.1.29-T HW Score: 23.33%, 7 of 30 points Sav =Homework: Hw 10.1 Part 1 of 6 Points: 0 of 1 The accompanying table lists the numbers of Internet users per 100 people and numbers of scientific award winners per 10 million people for different countries. Construct a scatterplot, find the value of the linear correlation coefficient r, and find the P-value of r. Determine whether there is sufficient evidence to su a claim of linear correlation between the two variables. Use a significance level of a = 0.05 Click to view the data on Internet users and scientific award winners. Construct a scatterplot. Choose the correct graph below. OB OC. OD. O A. 32 24 Award Winners 24 24 Q Award Winners Q 2 16 16 0 20 40 60 80 100 60 80 100 0 20 40 60 80 100 0 40 60 80 100 Internet Users Internet Users Internet Users Internet Users Internet users versus award winners X Internet Award Users (per Winners (per 100 10 million) 81.3 5. 80.7 24.9 32.9 98 49.9 0.8 79.6 5.2 38.5 0.1 92.2 25.1 88.3 8.5 77.9 8.5 80.1 13.9 52.8 1.1 74.4 12.6 57.9 2.6 77.3 1.3 89.6 10.8 98.7 24.7 68.4 2.5 58.9 1.1 65.7 2.1 89.6 32.3 87.9 31.9 90.3 20.3 82.4 98 Print Done= Homework: Hw 10.1 Question 14, 10.1.31-T HW Score: 23.33%, 7 of 30 points Save Part 1 of 6 O Points: 0 of 1 Police sometimes measure shoe prints at crime scenes so that they can learn something about criminals. Listed below are shoe print lengths and heights of males. Construct a scatterplot, find the value of the linear correlation coefficient r, and find the P-value of r. Determine whether there is sufficient evidence to support a claim of linear correlation between the two variables. Use a significance level of a = 0.05. Click to view the data on shoe print lengths and heights. Construct a scatterplot. Choose the correct graph below. O A. OB, OD. 2107 Q Height (cm) Height (cm) Height (cm 190 180 Height (or 180 180 190 180 160 160 160 160 20 24 28 32 36 40 20 24 28 32 36 40 20 24 28 32 36 40 20 24 28 32 36 40 Shoe Print Length (cm) Shoe Print Length (cm) Shoe Print Length (cm) Shoe Print Length (cm)Question 15, 10.1.33-E = Homework: Hw 10.1 HW Score: 23.33%, 7 of 30 points Part 1 of 6 Save O Points: 0 of 1 The accompanying table lists the word counts measured from men and women in 56 couple relationships. Construct a scatterplot, find the value of the linear correlation coefficient r, and find the P-value of r. Determine whether there is sufficient evidence to support a claim of linear correlation between the two variables. Use a significance level of a = 0.01. Click the icon to view the data on words spoken by the couples. Construct a scatterplot. Choose the correct graph below. O A. OB. OC. OD. 50000 50000 50000 Women (words) Women (words) Women (words) Women (words 50000 50000 Men (words) Men (words) Men (words) Men (words
Step by Step Solution
There are 3 Steps involved in it
Step: 1
Get Instant Access to Expert-Tailored Solutions
See step-by-step solutions with expert insights and AI powered tools for academic success
Step: 2
Step: 3
Ace Your Homework with AI
Get the answers you need in no time with our AI-driven, step-by-step assistance