

Answered step by step
Verified Expert Solution
Question
1 Approved Answer
Please answer #4 and 7 only!!! Name: ECONO03 - Microeconomics Homework Assignment #5 - Cost Analysis Using Accounting and Economic Techniques 2417 Fall Online Class:
Please answer #4 and 7 only!!! 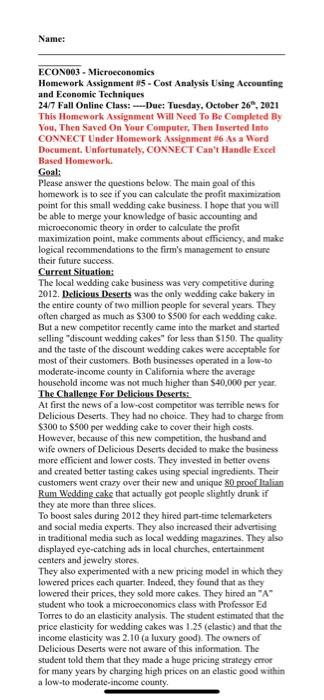
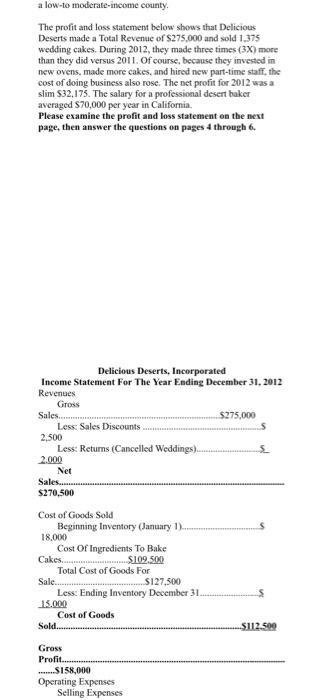
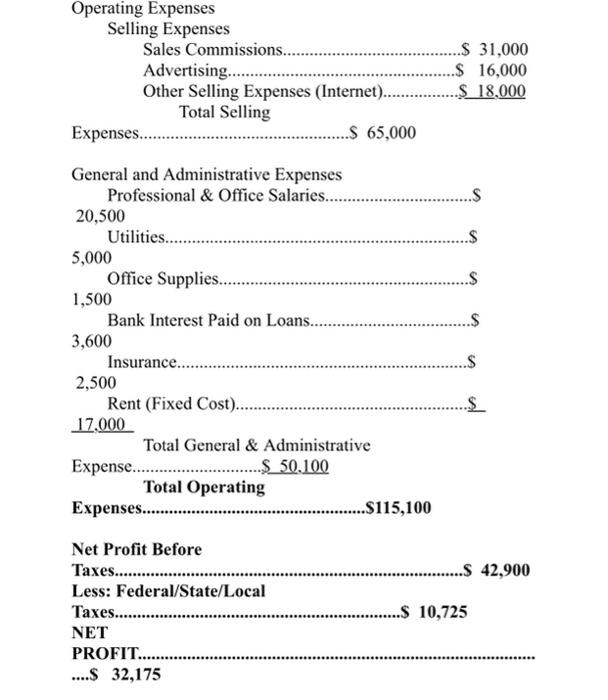
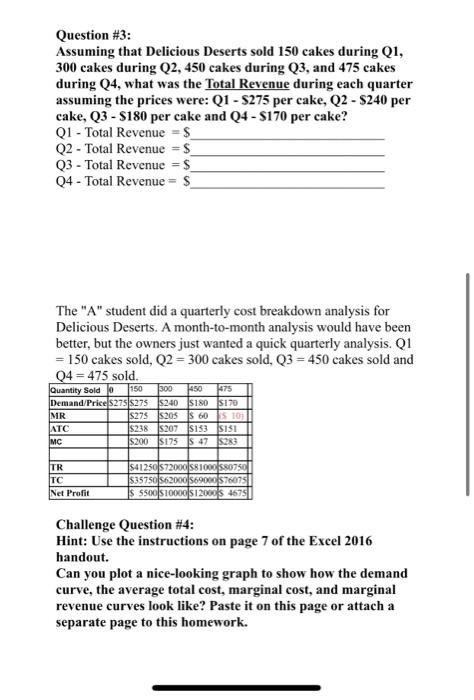
Name: ECONO03 - Microeconomics Homework Assignment #5 - Cost Analysis Using Accounting and Economic Techniques 2417 Fall Online Class: ----Due: Tuesday, October 26, 2021 This Homework Assignment Will Need To Be Completed By You, Then Saved On Your Computer, Then Inserted into CONNECT Under Homework Assignment #6 As a Word Document. Unfortunately, CONNECT Can't HandleExcel Based Homework. Goal: Please answer the questions below. The main goal of this homework is to see if you can calculate the profit maximization point for this small wedding cake business. I hope that you will be able to merge your knowledge of basic accounting and microeconomic theory in order to calculate the profit maximization point, make comments about efficiency, and make logical recommendations to the firm's management to ensure their future success Current Situation: The local wedding cake business was very competitive during 2012. Delicious Deserts was the only wedding cake bakery in the entire county of two million people for several years. They often charged as much as $300 to $500 for each wedding cake. But a new competitor recently came into the market and started selling "discount wedding cakes" for less than $150. The quality and the taste of the discount wedding cakes were acceptable for most of their customers. Both businesses operated in a low-to moderate-income county in California where the average household income was not much higher than $40,000 per year. The Challenge For Delicious Deserts: At first the news of a low-cost competitor was terrible news for Delicious Deserts. They had no choice. They had to charge from $300 to $500 per wedding cake to cover their high costs. However, because of this new competition, the husband and wife owners of Delicious Deserts decided to make the business more efficient and lower costs. They invested in better ovens and created better tasting cakes using special ingredients. Their customers went crazy over their new and unique 80 proof Italian Rum Wedding cake that actually got people slightly drunk if they ate more than three slices. To boost sales during 2012 they hired part-time telemarketers and social media experts. They also increased their advertising in traditional media such as local wedding magazines. They also displayed eye-catching ads in local churches, entertainment centers and jewelry stores They also experimented with a new pricing model in which they lowered prices each quarter. Indeed, they found that as they lowered their prices, they sold more cakes. They hired an "A" student who took a microeconomics class with Professor Ed Torres to do an elasticity analysis. The student estimated that the price elasticity for wedding cakes was 1.25 (elastic) and that the income elasticity was 2.10 (a luxury good). The owners of Delicious Deserts were not aware of this information. The student told them that they made a huge pricing strategy crror for many years by charging high prices on an elastic good within a low-to moderate-income county, a low-to moderate-income county. The profit and loss statement below shows that Delicious Deserts made a Total Revenue of S275.000 and sold 1.375 wedding cakes. During 2012, they made three times (3X) more than they did versus 2011. Of course, because they invested in new ovens, made more cakes, and hired new part-time staff, the cost of doing business also rose. The net profit for 2012 was a slim S32.175. The salary for a professional desert baker averaged $70,000 per year in California. Please examine the profit and loss statement on the next page, then answer the questions on pages through 6. Delicious Deserts, Incorporated Income Statement For The Year Ending December 31, 2012 Revenues Gross Sales.... $275,000 Less: Sales Discounts 2.500 Less: Returns (Cancelled Weddings) 2.000 Net Sales....... $270,500 Cost of Goods Sold Beginning Inventory (January 1). 18.000 Cost Of Ingredients To Bake Cakes. S109,500 Total Cost of Goods For Sale. S127,500 Less: Ending Inventory December 31 15.000 Cost of Goods Sold. $112.500 Gross Profit... ....S158,000 Operating Expenses Selling Expenses Operating Expenses Selling Expenses Sales Commissions.... Advertising............. Other Selling Expenses (Internet).. Total Selling Expenses.... ..$ 65,000 ..$ 31,000 $ 16,000 $ 18,000 ..S General and Administrative Expenses Professional & Office Salaries... 20,500 Utilities...... 5,000 Office Supplies.... 1,500 Bank Interest Paid on Loans....... 3,600 Insurance... 2,500 Rent (Fixed Cost)... 17,000 Total General & Administrative Expense...........................$ 50.100 Total Operating Expenses.......... ..$115,100 ........$ 42,900 Net Profit Before Taxes.......... Less: Federal/State/Local Taxes......... NET PROFIT.. ....$ 32,175 ..S 10,725 GO Question #3: Assuming that Delicious Deserts sold 150 cakes during Q1, 300 cakes during Q2, 450 cakes during Q3, and 475 cakes during Q4, what was the Total Revenue during each quarter assuming the prices were: Q1 - 5275 per cake, Q2 - $240 per cake, Q3 - $180 per cake and Q4 - $170 per cake? QI - Total Revenue = $ Q2 - Total Revenue = $ Q3 - Total Revenue = $ 04 - Total Revenue = $ The "A" student did a quarterly cost breakdown analysis for Delicious Deserts. A month-to-month analysis would have been better, but the owners just wanted a quick quarterly analysis. Q1 = 150 cakes sold, Q2 = 300 cakes sold, Q3 = 450 cakes sold and Q4 = 475 sold. Quantity Soldo 150 300 1450 475 Demand/Prices275 275 $240 $180 8170 MR S275 S205 S 60 S 10) ATC S238 S207 S133 SISI MC $200 $175 S 47 23 TR TC Net Profit 541250 572000 51000 sozso 535750562000 569000576075 $ $500 $10000 $12000 4675 Challenge Question #4: Hint: Use the instructions on page 7 of the Excel 2016 handout. Can you plot a nice-looking graph to show how the demand curve, the average total cost, marginal cost, and marginal revenue curves look like? Paste it on this page or attach a separate page to this homework. Question #7 Do you have any other recommendations for Delicious Deserts to increase their revenues, profits, market share, and client retention? 1 Step by Step Solution
There are 3 Steps involved in it
Step: 1

Get Instant Access to Expert-Tailored Solutions
See step-by-step solutions with expert insights and AI powered tools for academic success
Step: 2

Step: 3
Ace Your Homework with AI
Get the answers you need in no time with our AI-driven, step-by-step assistance
Get Started
Analysing Financial Statements For Non-Specialists
Authors: Jim OHare
2nd Edition
1138641529, 9781138641525