
 Please answer a through d and explain using the prompt above. Thank you!
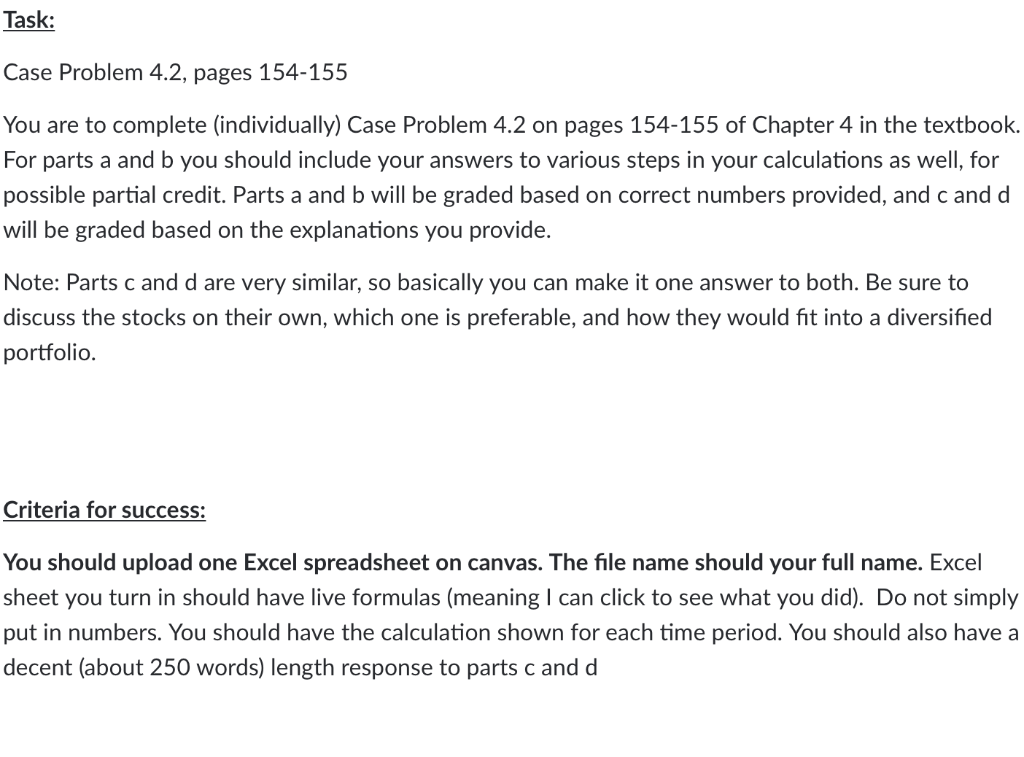
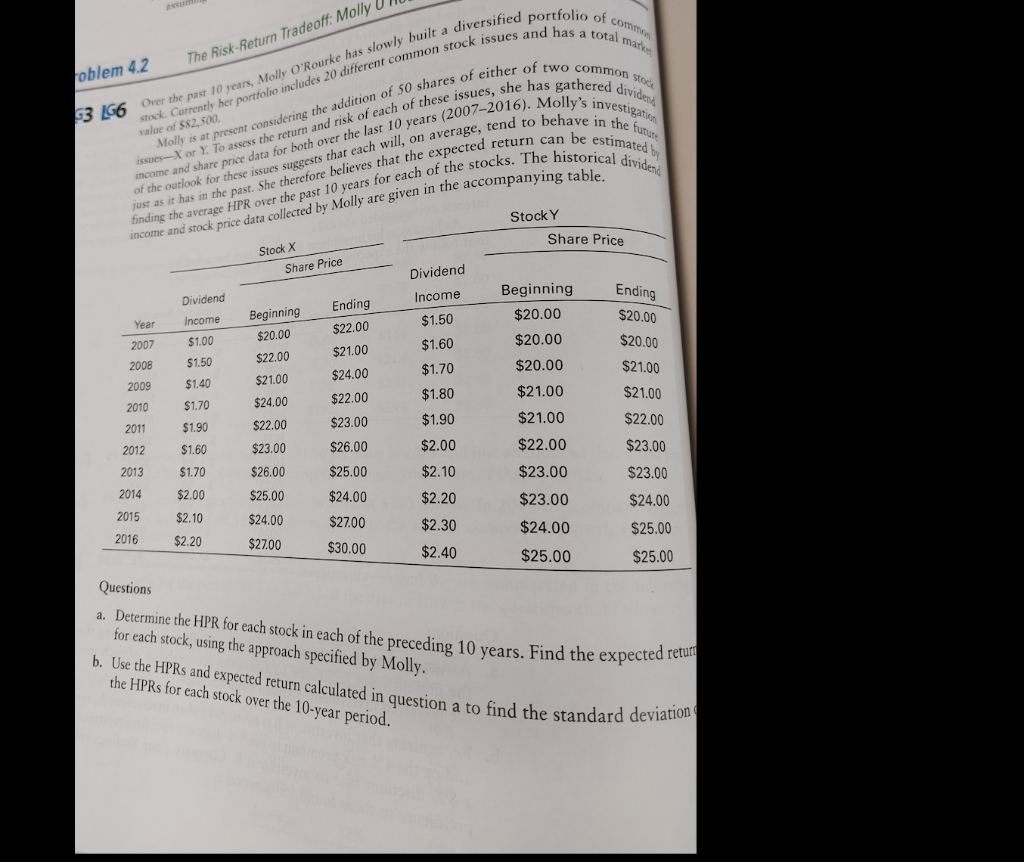
Task: Case Problem 4.2, pages 154-155 You are to complete (individually) Case Problem 4.2 on pages 154-155 of Chapter 4 in the textbook. For parts a and b you should include your answers to various steps in your calculations as well, for possible partial credit. Parts a and b will be graded based on correct numbers provided, and c and d will be graded based on the explanations you provide. Note: Parts c and d are very similar, so basically you can make it one answer to both. Be sure to discuss the stocks on their own, which one is preferable, and how they would fit into a diversified portfolio. Criteria for success: You should upload one Excel spreadsheet on canvas. The file name should your full name. Excel sheet you turn in should have live formulas (meaning I can click to see what you did). Do not simply put in numbers. You should have the calculation shown for each time period. You should also have a decent (about 250 words) length response to parts c and d assur The Risk-Return Tradeoff: Molly U oblem 4.2 value of $82,500. G3 LG6 Over the past 10 years, Molly O'Rourke has slowly built a diversified portfolio of common stock. Currently her portfolio includes 20 different common stock issues and has a total marke Molly is at present considering the addition of 50 shares of either of two common stock of the outlook for these issues suggests that each will, on average, tend to behave in the future income and share price data for both over the last 10 years (2007-2016). Molly's investigation just as it has in the past. She therefore believes that the expected return can be estimated by issues-X or Y. To assess the return and risk of each of these issues, she has gathered dividend finding the average HPR over the past 10 years for each of the stocks. The historical dividend Stock Y income and stock price data collected by Molly are given in the accompanying table. Share Price Stock X Share Price Dividend Dividend Income Beginning. Ending Ending Beginning Year Income $1.50 $20.00 $20.00 $22.00 $20.00 2007 $1.00 $1.60 $20.00 $20.00 $21.00 2008 $22.00 $1.50 $1.70 $20.00 $24.00 $21.00 2009 $1.40 $21.00 $1.80 $21.00 $22.00 2010 $1.70 $24.00 $21.00 2011 $1.90 $22.00 $23.00 $1.90 $21.00 $22.00 2012 $1.60 $23.00 $26.00 $2.00 $22.00 $23.00 2013 $1.70 $26.00 $25.00 $2.10 $23.00 $23.00 2014 $2.00 $25.00 $24.00 $2.20 $23.00 $24.00 2015 $2.10 $24.00 $27.00 $2.30 $24.00 2016 $2.20 $25.00 $27.00 $30.00 $2.40 $25.00 $25.00 Questions a. Determine the HPR for each stock in each of the preceding 10 years. Find the expected retur for each stock, using the approach specified by Molly. b. Use the HPRs and expected return calculated in question a to find the standard deviation the HPRs for each stock over the 10-year period. 155 CHAPTER 4 RETURN AND RISK c. Use your findings to evaluate and discuss the return and risk associated with stocks X and Y. Which stock seems preferable? Explain. d. Ignoring her existing portfolio, what recommendations would you give Molly with regard to stocks X and Y


 Please answer a through d and explain using the prompt above. Thank you!


