Answered step by step
Verified Expert Solution
Question
1 Approved Answer
please answer a-c 11. Superior Lessons offers three product lines: music lessons, sports lessons, and early grades tutoring after school lessons. The following charts were


please answer a-c
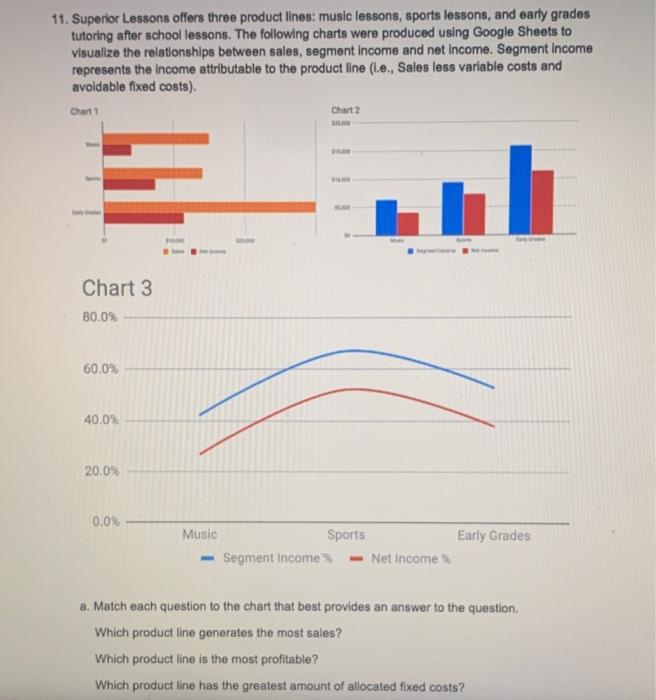
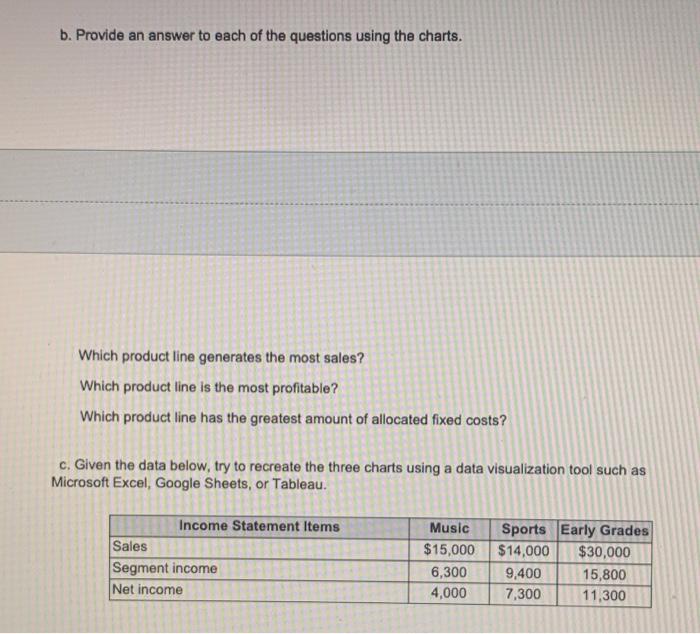
11. Superior Lessons offers three product lines: music lessons, sports lessons, and early grades tutoring after school lessons. The following charts were produced using Google Sheets to visualize the relationships between sales, segment income and net income. Segment Income represents the income attributable to the product line (l.e., Sales less variable costs and avoidable fixed costs). Chart 1 Chart 3 80.0% 60.0% 40.0% 20.0% 0.0% - FRAK Music Chart 2 KLAN FILM | Expre Sports -Segment Income % -Net Income % Early Grades a. Match each question to the chart that best provides an answer to the question. Which product line generates the most sales? Which product line is the most profitable? Which product line has the greatest amount of allocated fixed costs? b. Provide an answer to each of the questions using the charts. Which product line generates the most sales? Which product line is the most profitable? Which product line has the greatest amount of allocated fixed costs? c. Given the data below, try to recreate the three charts using a data visualization tool such as Microsoft Excel, Google Sheets, or Tableau. Income Statement Items SalesT Segment income Net income Music Sports Early Grades $15,000 $14,000 $30,000 9,400 7,300 6,300 4,000 15,800 11,300 11. Superior Lessons offers three product lines: music lessons, sports lessons, and early grades tutoring after school lessons. The following charts were produced using Google Sheets to visualize the relationships between sales, segment income and net income. Segment Income represents the income attributable to the product line (l.e., Sales less variable costs and avoidable fixed costs). Chart 1 Chart 3 80.0% 60.0% 40.0% 20.0% 0.0% - FRAK Music Chart 2 KLAN FILM | Expre Sports -Segment Income % -Net Income % Early Grades a. Match each question to the chart that best provides an answer to the question. Which product line generates the most sales? Which product line is the most profitable? Which product line has the greatest amount of allocated fixed costs? b. Provide an answer to each of the questions using the charts. Which product line generates the most sales? Which product line is the most profitable? Which product line has the greatest amount of allocated fixed costs? c. Given the data below, try to recreate the three charts using a data visualization tool such as Microsoft Excel, Google Sheets, or Tableau. Income Statement Items SalesT Segment income Net income Music Sports Early Grades $15,000 $14,000 $30,000 9,400 7,300 6,300 4,000 15,800 11,300 Step by Step Solution
There are 3 Steps involved in it
Step: 1

Get Instant Access to Expert-Tailored Solutions
See step-by-step solutions with expert insights and AI powered tools for academic success
Step: 2

Step: 3

Ace Your Homework with AI
Get the answers you need in no time with our AI-driven, step-by-step assistance
Get Started


