

Answered step by step
Verified Expert Solution
Question
1 Approved Answer
Please answer all 1. Open a new Tableau Workbook from the File menu. Select the Connect to Data option in the Data tab on your
Please answer all 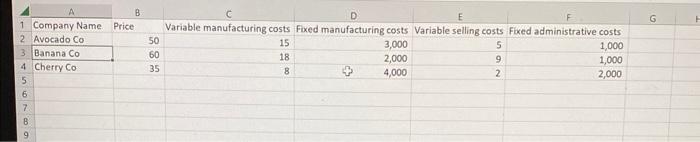

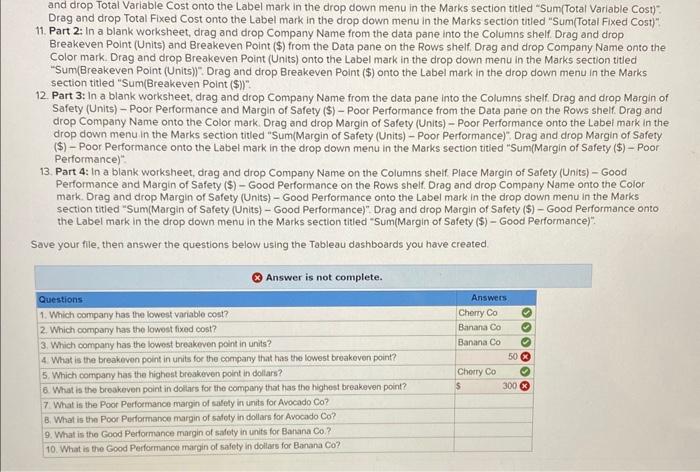
1. Open a new Tableau Workbook from the File menu. Select the "Connect to Data" option in the Data tab on your blank worksheet page, or you can select Data Source in the bottom left hand corner. Next, select Microsoft Excel in the list of connection sources. You will then select the Excel data flle you just downloaded in your flle explorer: 2. Within the Sheet1 tab, create a calculated field by either right clicking anywhere in the blank space of the Data pane and selecting Create Calculated Field or click the Analysis tab and select Create Calculated Field from the dropdown menu. Title the new variable "Total Variable Cost". In the space for formulas, sum Variable Manufacturing Costs and Variable Selling Costs. 3. Create a calculated field by either right clicking anywhere in the blank space of the Data pane and selecting Create Calculated Fleld or click the Analysis tab and select Create Calculated Fleld from the dropdown menu. Title the new variable "Total Fixed Cost". In the space for formulas, sum Fixed Manufacturing Costs and the Fixed Administrative Costs. 4. Create a calculated field by either right clicking anywhere in the blank space of the Data pane and selecting Create Calculated Fleid or click the Analysis tab and select Create Calculated Field from the dropdown menu. Title the new variable "Breakeven Point (Units): In the space for formulas, divide the Fixed Costs by the contribution margin per unit. The contribution margin per unit can be calculated by subtracting the Variable Costs from Price. So, the formula will look like the following "[Total Fixed Costs] 1 ([Price) - [Total Variable Costs)". 5. Create a calculated field by either right clicking anywhere in the blank space of the Data pane and selecting Create Calculated Field or click the Analysis tab and select Create Calculated Field from the dropdown menu. Title the new variable "Breakeven Point ($), In the space for formulas, divide the Fixed Costs by the contribution margin ratio. The contribution margin ratio can be calculated by subtracting the Variable Costs from Price then dividing by Price So, the formula will look like the following "[Total Fixed Costs] / (CPrice] - [Total Variable Costs] / [Price])" 6. Create a calculated field by either right clicking anywhere in the blank space of the Data pane and selecting Create Caiculated Field or click the Analysis tab and select Create Calculated Fleid from the dropdown menu. Title the new variable "Margin of Safety (Units) - Poor Performance". Assume the company only sells 300 units. In the space for formulas, subtract the Breakeven Point (Units) from 300 . So, the formula will look like the following 300 - Breakeven Point (Units)" 7. Create a calculated field by either right clicking anywhere in the blank space of the Data pane and selecting Create Calculated Fieid or click the Analysis tab and select Create Calculated Field from the dropdown menu. Title the new variable "Margin of Safety (\$) - Poor Performance:- Assume the company only selis 300 units. In the space for formulas, subtract the Breakeven Point (\$) from 300 multiplied by Price. So, the formula will look like the following "( 300 Price) - Breakeven Point (\$)". 8. Create a calculated field by either right clicking anywhere in the blank space of the Data pane and selecting Create Calculated Field or click the Analysis tab and select Create Caiculated Field from the dropdown menu. Title the new varrable "Margin of Safety (Units) - Good Performance". Assume the company sells 10,000 units. In the space for formulas, subtract the Breakeven Point (Units) from 10.000. So, the formula will look like the following "10000 - Breakeven Point (Units)". (NOTE: Commas cannot be used in Tableau formulas) 9. Create a calculated field by either right clicking anywhere in the blank space of the Data pane and selecting Create Calculated Fleld or click the Analysis tab and select Create Caiculated Field from the dropdown menu. Title the new variable "Margin of Safety (S) - Good Performance". Assume the company sells 10,000 units, in the space for formulas, subtract the Breakeven Point Orop op Iotal vartable Cost onto the Label mark in the drop down menu in the Marks section titled "Sum(Total Variable Cost)" Drag and drop Total Fixed Cost onto the Label mark in the drop down menu in the Marks section titled "Sum(Total Fixed Cost)". 11. Part 2: In a blank worksheet, drag and drop Company Name from the data pane into the Columns shelf. Drag and drop Breakeven Point (Units) and Breakeven Point (\$) from the Data pane on the Rows shelf. Drag and drop Company Name onto the Color mark. Drag and drop Breakeven Point (Units) onto the Label mark in the drop down menu in the Marks section titled "Sum(Breakeven Point (Units))". Drag and drop Breakeven Point (\$) onto the Label mark in the drop down menu in the Marks section titled "Sum(Breakeven Point (\$))" 12. Part 3: In a blank worksheet, drag and drop Company Name from the data pane into the Columns shelf. Drag and drop Margin of Safety (Units) - Poor Performance and Margin of Safety (S) - Poor Performance from the Data pane on the Rows shelf. Drag and drop Company Name onto the Color mark. Drag and drop Margin of Safety (Units) - Poor Performance onto the Label mark in the drop down menu in the Marks section titled "Sum(Margin of Safety (Units) - Poor Performance)" Drag and drop Margin of Safety (\$) - Poor Performance onto the Label mark in the drop down menu in the Marks section titied "Sum(Margin of Safery (\$) - Poor Performance)". 13. Part 4: In a blank worksheet, drag and drop Company Name on the Columns shelf. Place Margin of Safety (Units) - Good Performance and Margin of Safety (\$) - Good Performance on the Rows shelf. Drag and drop Company Name onto the Color mark. Drag and drop Margin of Safety (Units) - Good Performance onto the Label mark in the drop down menu in the Marks section titled "Sum(Margin of Safety (Units) - Good Performance)". Drag and drop Margin of Safety (\$) - Good Performance onto the Label mark in the drop down menu in the Marks section titled "Sum(Margin of Safety (\$) - Good Performance)". Save your flie, then answer the questions below using the Tableau dashboards you have created Step by Step Solution
There are 3 Steps involved in it
Step: 1

Get Instant Access to Expert-Tailored Solutions
See step-by-step solutions with expert insights and AI powered tools for academic success
Step: 2

Step: 3
Ace Your Homework with AI
Get the answers you need in no time with our AI-driven, step-by-step assistance
Get Started
Real Estate Finance
Authors: John P. Wiedemer
8th Edition
0324142900, 9780324142907