please answer all asap
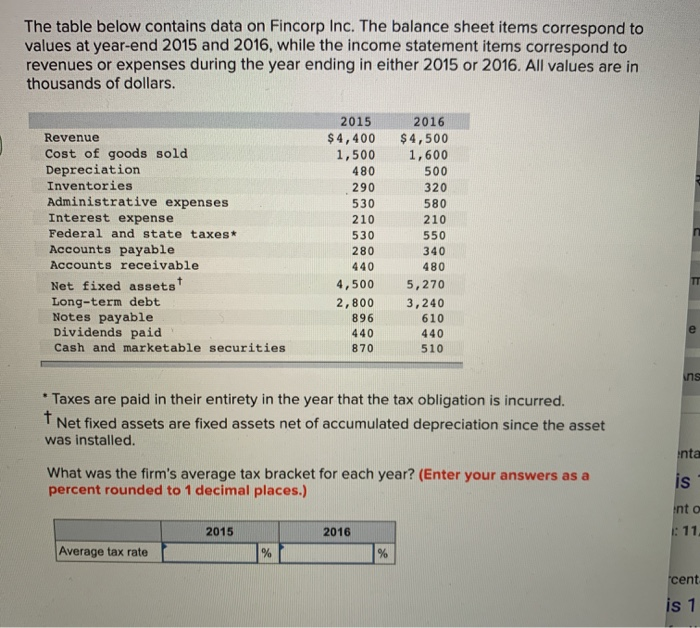
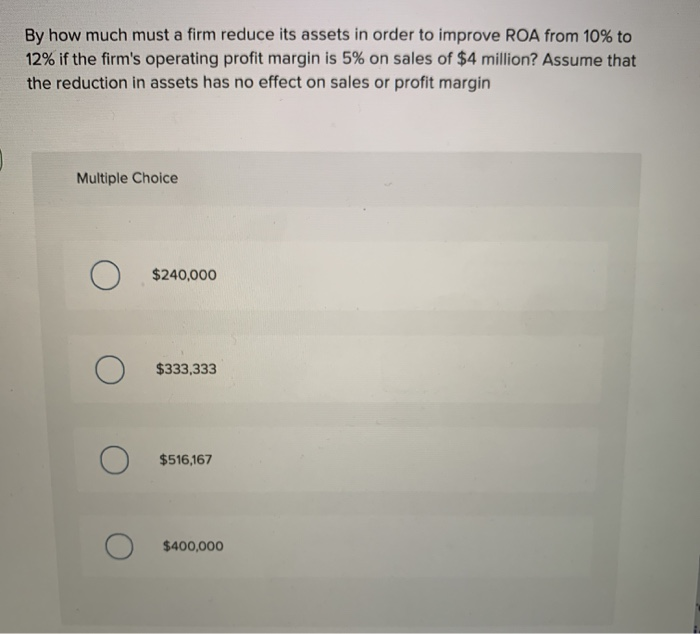
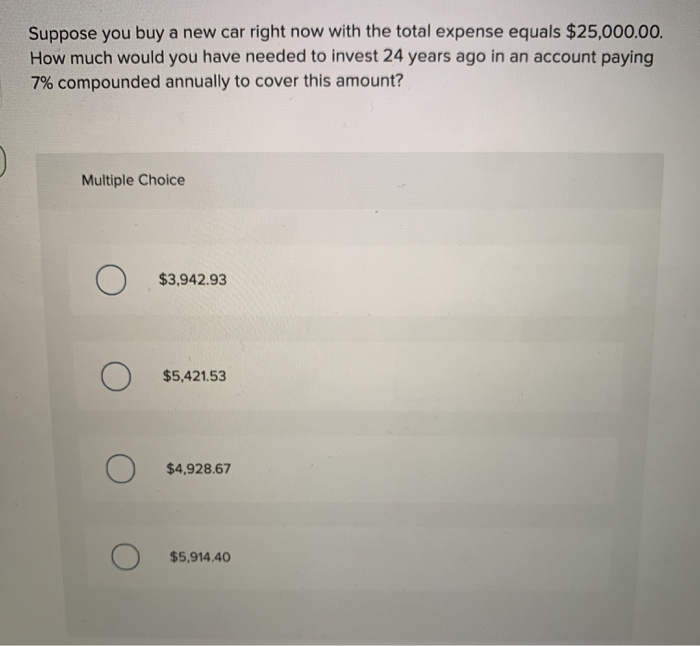
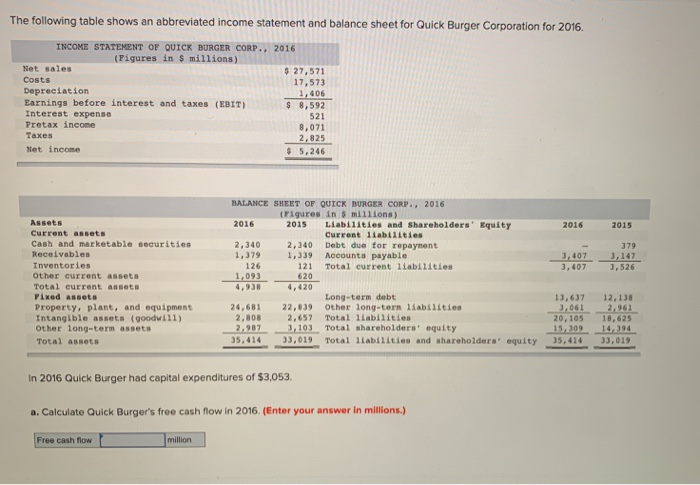
The table below contains data on Fincorp Inc. The balance sheet items correspond to values at year-end 2015 and 2016, while the income statement items correspond to revenues or expenses during the year ending in either 2015 or 2016. All values are in thousands of dollars. Revenue Cost of goods sold Depreciation Inventories Administrative expenses Interest expense Federal and state taxes* Accounts payable Accounts receivable Net fixed assets Long-term debt Notes payable Dividends paid Cash and marketable securities 2015 $4,400 1,500 480 290 530 210 530 280 440 4,500 2,800 896 440 870 2016 $4,500 1,600 500 320 580 210 550 340 480 5,270 3,240 610 440 510 ins 8 * Taxes are paid in their entirety in the year that the tax obligation is incurred. t Net fixed assets are fixed assets net of accumulated depreciation since the asset was installed. What was the firm's average tax bracket for each year? (Enter your answers as a percent rounded to 1 decimal places.) inta is into 2015 2016 E: 11 Average tax rate % % 'cent is 1 By how much must a firm reduce its assets in order to improve ROA from 10% to 12% if the firm's operating profit margin is 5% on sales of $4 million? Assume that the reduction in assets has no effect on sales or profit margin Multiple Choice $240,000 $333,333 $516,167 $400,000 Suppose you buy a new car right now with the total expense equals $25,000.00. How much would you have needed to invest 24 years ago in an account paying 7% compounded annually to cover this amount? Multiple Choice $3,942.93 $5,421.53 $4.928.67 $5,914.40 The following table shows an abbreviated income statement and balance sheet for Quick Burger Corporation for 2016, INCOME STATEMENT OF QUICK BURGER CORP., 2016 (Figures in $ millions) Net sales $ 27,571 Costs 17,573 Depreciation 1,406 Earnings before interest and taxes (EBIT) $ 8,592 Interest expense 521 Pretax income 8,071 Taxes 2,825 Net income $ 5,246 2016 2015 3,407 3,407 BALANCE SHEET OF QUICK BURGER CORP., 2016 (Figures in 5 millions) 2016 2015 Liabilities and shareholders' Equity Current liabilities 2,340 2,340 Debt due for repayment 1,379 1,339 Accounts payable 126 121 Total current liabilities 1,093 620 4,420 Long-term debt 24,681 22,839 Other long-tern liabilities 2,808 2,657 Total liabilities 2,987 3,103 Total shareholders' equity 35,414 33,019 Total liabilities and shareholders' equity Assets Current assets Cash and marketable securities Receivables Inventories Other current assets Total current assets Fixed assets Property, plant, and equipment Intangible assets (goodwill) Other long-term assets Total assets 379 3,147 3,526 13,637 3,061 20,105 15,309 35,414 12,138 2,961 18,625 14.394 33,019 In 2016 Quick Burger had capital expenditures of $3,053. a. Calculate Quick Burger's free cash flow in 2016. (Enter your answer in millions.) Free cash flow million