Please answer all parts (a)-(d).
Excel spreadsheet:
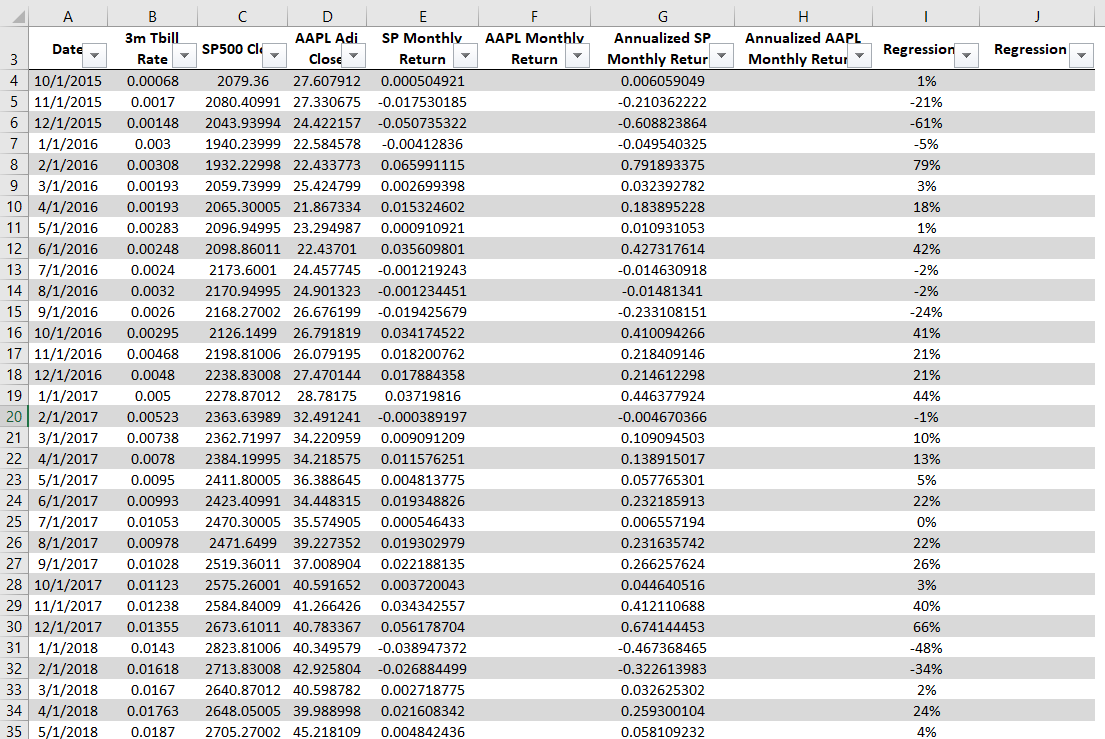
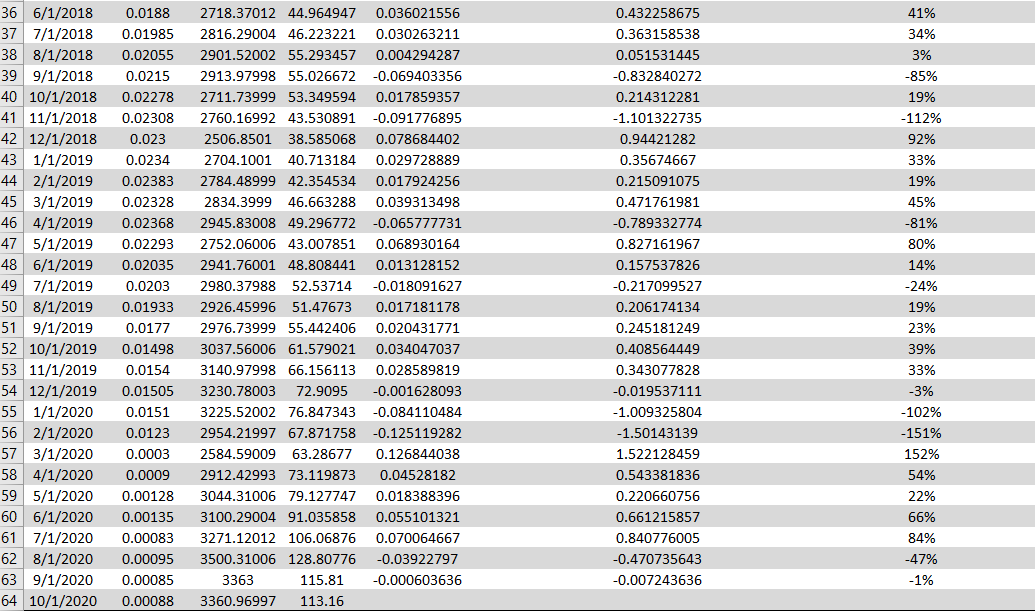
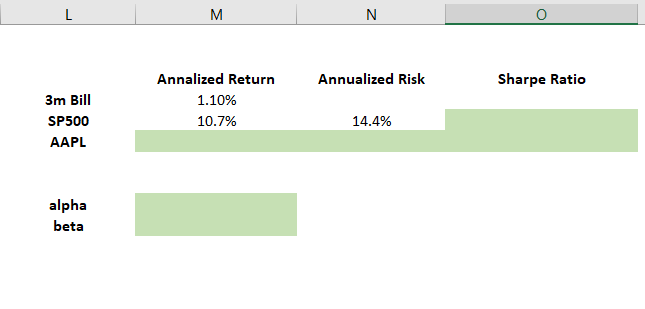
(3 pts) Performance - Using 5 year historical monthly data for 3 month T-Bill rate, SP 500 index, and Apple's price in Excel spreadsheet, compute (a) Monthly returns for SP 500 and Apple (X(t+1 month)/X(t) 1) (b) Annualized returns (divide monthly returns by 1/12) (c) Average 3 month T-Bill rate as proxy for risk-free rate (d) Jensen's alpha for Apple (Hint: Use Excel's INTERCEPT function on annualized excess (over risk-free rate) returns A AAPL Monthly Return H Annualized AAPL Monthly Retur Regression Regression 1% -21% -61% -5% 79% 3% 18% 1% 42% -2% -2% -24% Date 3 4 10/1/2015 5 11/1/2015 6 12/1/2015 7 1/1/2016 8 2/1/2016 9 3/1/2016 10 4/1/2016 11 5/1/2016 12 6/1/2016 13 7/1/2016 14 8/1/2016 15 9/1/2016 16 10/1/2016 17 11/1/2016 18 12/1/2016 19 1/1/2017 20 2/1/2017 21 3/1/2017 22 4/1/2017 23 5/1/2017 24 6/1/2017 25 7/1/2017 26 8/1/2017 27 9/1/2017 28 10/1/2017 29 11/1/2017 30 12/1/2017 31 1/1/2018 32 2/1/2018 33 3/1/2018 34 4/1/2018 35 5/1/2018 3m Tbill Rate 0.00068 0.0017 0.00148 0.003 0.00308 0.00193 0.00193 0.00283 0.00248 0.0024 0.0032 0.0026 0.00295 0.00468 0.0048 0.005 0.00523 0.00738 0.0078 0.0095 0.00993 0.01053 0.00978 0.01028 0.01123 0.01238 0.01355 0.0143 0.01618 0.0167 0.01763 0.0187 AAPL Adi SP500 Cle Close 2079.36 27.607912 2080.40991 27.330675 2043.93994 24.422157 1940.23999 22.584578 1932.22998 22.433773 2059.73999 25.424799 2065.30005 21.867334 2096.94995 23.294987 2098.86011 22.43701 2173.6001 24.457745 2170.94995 24.901323 2168.27002 26.676199 2126.1499 26.791819 2198.81006 26.079195 2238.83008 27.470144 2278.87012 28.78175 2363.63989 32.491241 2362.71997 34.220959 2384.19995 34.218575 2411.80005 36.388645 2423.40991 34.448315 2470.30005 35.574905 2471.6499 39.227352 2519.36011 37.008904 2575.26001 40.591652 2584.84009 41.266426 2673.61011 40.783367 2823.81006 40.349579 2713.83008 42.925804 2640.87012 40.598782 2648.05005 39.988998 2705.27002 45.218109 SP Monthly Return 0.000504921 -0.017530185 -0.050735322 -0.00412836 0.065991115 0.002699398 0.015324602 0.000910921 0.035609801 -0.001219243 -0.001234451 -0.019425679 0.034174522 0.018200762 0.017884358 0.03719816 -0.000389197 0.009091209 0.011576251 0.004813775 0.019348826 0.000546433 0.019302979 0.022188135 0.003720043 0.034342557 0.056178704 -0.038947372 -0.026884499 0.002718775 0.021608342 0.004842436 Annualized SP Monthly Retur 0.006059049 -0.210362222 -0.608823864 -0.049540325 0.791893375 0.032392782 0.183895228 0.010931053 0.427317614 -0.014630918 -0.01481341 -0.233108151 0.410094266 0.218409146 0.214612298 0.446377924 -0.004670366 0.109094503 0.138915017 0.057765301 0.232185913 0.006557194 0.231635742 0.266257624 0.044640516 0.412110688 0.674144453 -0.467368465 -0.322613983 0.032625302 0.259300104 0.058109232 41% 21% 21% 44% -1% 10% 13% 5% 22% 0% 22% 26% 3% 40% 66% -48% -34% 2% 24% 4% 41% 34% 3% -85% 19% -112% 92% 33% 19% 45% -81% 80% 14% 36 6/1/2018 37 7/1/2018 38 8/1/2018 39 9/1/2018 40 10/1/2018 41 11/1/2018 42 12/1/2018 43 1/1/2019 44 2/1/2019 45 3/1/2019 46 4/1/2019 47 5/1/2019 48 6/1/2019 49 7/1/2019 50 8/1/2019 51 9/1/2019 52 10/1/2019 53 11/1/2019 54 12/1/2019 55 1/1/2020 56 2/1/2020 57 3/1/2020 58 4/1/2020 59 5/1/2020 60 6/1/2020 61 7/1/2020 62 8/1/2020 63 9/1/2020 64 10/1/2020 0.0188 0.01985 0.02055 0.0215 0.02278 0.02308 0.023 0.0234 0.02383 0.02328 0.02368 0.02293 0.02035 0.0203 0.01933 0.0177 0.01498 0.0154 0.01505 0.0151 0.0123 0.0003 0.0009 0.00128 0.00135 0.00083 0.00095 0.00085 0.00088 2718.37012 44.964947 2816.29004 46.223221 2901.52002 55.293457 2913.97998 55.026672 2711.73999 53.349594 2760.16992 43.530891 2506.8501 38.585068 2704.1001 40.713184 2784.48999 42.354534 2834.3999 46.663288 2945.83008 49.296772 2752.06006 43.007851 2941.76001 48.808441 2980.37988 52.53714 2926.45996 51.47673 2976.73999 55.442406 3037.56006 61.579021 3140.97998 66.156113 3230.78003 72.9095 3225.52002 76.847343 2954.21997 67.871758 2584.59009 63.28677 2912.42993 73.119873 3044.31006 79.127747 3100.29004 91.035858 3271.12012 106.06876 3500.31006 128.80776 3363 115.81 3360.96997 113.16 0.036021556 0.030263211 0.004294287 -0.069403356 0.017859357 -0.091776895 0.078684402 0.029728889 0.017924256 0.039313498 -0.065777731 0.068930164 0.013128152 -0.018091627 0.017181178 0.020431771 0.034047037 0.028589819 -0.001628093 -0.084110484 -0.125119282 0.126844038 0.04528182 0.018388396 0.055101321 0.070064667 -0.03922797 -0.000603636 0.432258675 0.363158538 0.051531445 -0.832840272 0.214312281 -1.101322735 0.94421282 0.35674667 0.215091075 0.471761981 -0.789332774 0.827161967 0.157537826 -0.217099527 0.206174134 0.245181249 0.408564449 0.343077828 -0.019537111 -1.009325804 -1.50143139 1.522128459 0.543381836 0.220660756 0.661215857 0.840776005 -0.470735643 -0.007243636 -24% 19% 23% 39% 33% -3% -102% -151% 152% 54% 22% 66% 84% -47% -1% L M N Annualized Risk Sharpe Ratio 3m Bill SP500 AAPL Annalized Return 1.10% 10.7% 14.4% alpha beta (3 pts) Performance - Using 5 year historical monthly data for 3 month T-Bill rate, SP 500 index, and Apple's price in Excel spreadsheet, compute (a) Monthly returns for SP 500 and Apple (X(t+1 month)/X(t) 1) (b) Annualized returns (divide monthly returns by 1/12) (c) Average 3 month T-Bill rate as proxy for risk-free rate (d) Jensen's alpha for Apple (Hint: Use Excel's INTERCEPT function on annualized excess (over risk-free rate) returns A AAPL Monthly Return H Annualized AAPL Monthly Retur Regression Regression 1% -21% -61% -5% 79% 3% 18% 1% 42% -2% -2% -24% Date 3 4 10/1/2015 5 11/1/2015 6 12/1/2015 7 1/1/2016 8 2/1/2016 9 3/1/2016 10 4/1/2016 11 5/1/2016 12 6/1/2016 13 7/1/2016 14 8/1/2016 15 9/1/2016 16 10/1/2016 17 11/1/2016 18 12/1/2016 19 1/1/2017 20 2/1/2017 21 3/1/2017 22 4/1/2017 23 5/1/2017 24 6/1/2017 25 7/1/2017 26 8/1/2017 27 9/1/2017 28 10/1/2017 29 11/1/2017 30 12/1/2017 31 1/1/2018 32 2/1/2018 33 3/1/2018 34 4/1/2018 35 5/1/2018 3m Tbill Rate 0.00068 0.0017 0.00148 0.003 0.00308 0.00193 0.00193 0.00283 0.00248 0.0024 0.0032 0.0026 0.00295 0.00468 0.0048 0.005 0.00523 0.00738 0.0078 0.0095 0.00993 0.01053 0.00978 0.01028 0.01123 0.01238 0.01355 0.0143 0.01618 0.0167 0.01763 0.0187 AAPL Adi SP500 Cle Close 2079.36 27.607912 2080.40991 27.330675 2043.93994 24.422157 1940.23999 22.584578 1932.22998 22.433773 2059.73999 25.424799 2065.30005 21.867334 2096.94995 23.294987 2098.86011 22.43701 2173.6001 24.457745 2170.94995 24.901323 2168.27002 26.676199 2126.1499 26.791819 2198.81006 26.079195 2238.83008 27.470144 2278.87012 28.78175 2363.63989 32.491241 2362.71997 34.220959 2384.19995 34.218575 2411.80005 36.388645 2423.40991 34.448315 2470.30005 35.574905 2471.6499 39.227352 2519.36011 37.008904 2575.26001 40.591652 2584.84009 41.266426 2673.61011 40.783367 2823.81006 40.349579 2713.83008 42.925804 2640.87012 40.598782 2648.05005 39.988998 2705.27002 45.218109 SP Monthly Return 0.000504921 -0.017530185 -0.050735322 -0.00412836 0.065991115 0.002699398 0.015324602 0.000910921 0.035609801 -0.001219243 -0.001234451 -0.019425679 0.034174522 0.018200762 0.017884358 0.03719816 -0.000389197 0.009091209 0.011576251 0.004813775 0.019348826 0.000546433 0.019302979 0.022188135 0.003720043 0.034342557 0.056178704 -0.038947372 -0.026884499 0.002718775 0.021608342 0.004842436 Annualized SP Monthly Retur 0.006059049 -0.210362222 -0.608823864 -0.049540325 0.791893375 0.032392782 0.183895228 0.010931053 0.427317614 -0.014630918 -0.01481341 -0.233108151 0.410094266 0.218409146 0.214612298 0.446377924 -0.004670366 0.109094503 0.138915017 0.057765301 0.232185913 0.006557194 0.231635742 0.266257624 0.044640516 0.412110688 0.674144453 -0.467368465 -0.322613983 0.032625302 0.259300104 0.058109232 41% 21% 21% 44% -1% 10% 13% 5% 22% 0% 22% 26% 3% 40% 66% -48% -34% 2% 24% 4% 41% 34% 3% -85% 19% -112% 92% 33% 19% 45% -81% 80% 14% 36 6/1/2018 37 7/1/2018 38 8/1/2018 39 9/1/2018 40 10/1/2018 41 11/1/2018 42 12/1/2018 43 1/1/2019 44 2/1/2019 45 3/1/2019 46 4/1/2019 47 5/1/2019 48 6/1/2019 49 7/1/2019 50 8/1/2019 51 9/1/2019 52 10/1/2019 53 11/1/2019 54 12/1/2019 55 1/1/2020 56 2/1/2020 57 3/1/2020 58 4/1/2020 59 5/1/2020 60 6/1/2020 61 7/1/2020 62 8/1/2020 63 9/1/2020 64 10/1/2020 0.0188 0.01985 0.02055 0.0215 0.02278 0.02308 0.023 0.0234 0.02383 0.02328 0.02368 0.02293 0.02035 0.0203 0.01933 0.0177 0.01498 0.0154 0.01505 0.0151 0.0123 0.0003 0.0009 0.00128 0.00135 0.00083 0.00095 0.00085 0.00088 2718.37012 44.964947 2816.29004 46.223221 2901.52002 55.293457 2913.97998 55.026672 2711.73999 53.349594 2760.16992 43.530891 2506.8501 38.585068 2704.1001 40.713184 2784.48999 42.354534 2834.3999 46.663288 2945.83008 49.296772 2752.06006 43.007851 2941.76001 48.808441 2980.37988 52.53714 2926.45996 51.47673 2976.73999 55.442406 3037.56006 61.579021 3140.97998 66.156113 3230.78003 72.9095 3225.52002 76.847343 2954.21997 67.871758 2584.59009 63.28677 2912.42993 73.119873 3044.31006 79.127747 3100.29004 91.035858 3271.12012 106.06876 3500.31006 128.80776 3363 115.81 3360.96997 113.16 0.036021556 0.030263211 0.004294287 -0.069403356 0.017859357 -0.091776895 0.078684402 0.029728889 0.017924256 0.039313498 -0.065777731 0.068930164 0.013128152 -0.018091627 0.017181178 0.020431771 0.034047037 0.028589819 -0.001628093 -0.084110484 -0.125119282 0.126844038 0.04528182 0.018388396 0.055101321 0.070064667 -0.03922797 -0.000603636 0.432258675 0.363158538 0.051531445 -0.832840272 0.214312281 -1.101322735 0.94421282 0.35674667 0.215091075 0.471761981 -0.789332774 0.827161967 0.157537826 -0.217099527 0.206174134 0.245181249 0.408564449 0.343077828 -0.019537111 -1.009325804 -1.50143139 1.522128459 0.543381836 0.220660756 0.661215857 0.840776005 -0.470735643 -0.007243636 -24% 19% 23% 39% 33% -3% -102% -151% 152% 54% 22% 66% 84% -47% -1% L M N Annualized Risk Sharpe Ratio 3m Bill SP500 AAPL Annalized Return 1.10% 10.7% 14.4% alpha beta


