Answered step by step
Verified Expert Solution
Question
1 Approved Answer
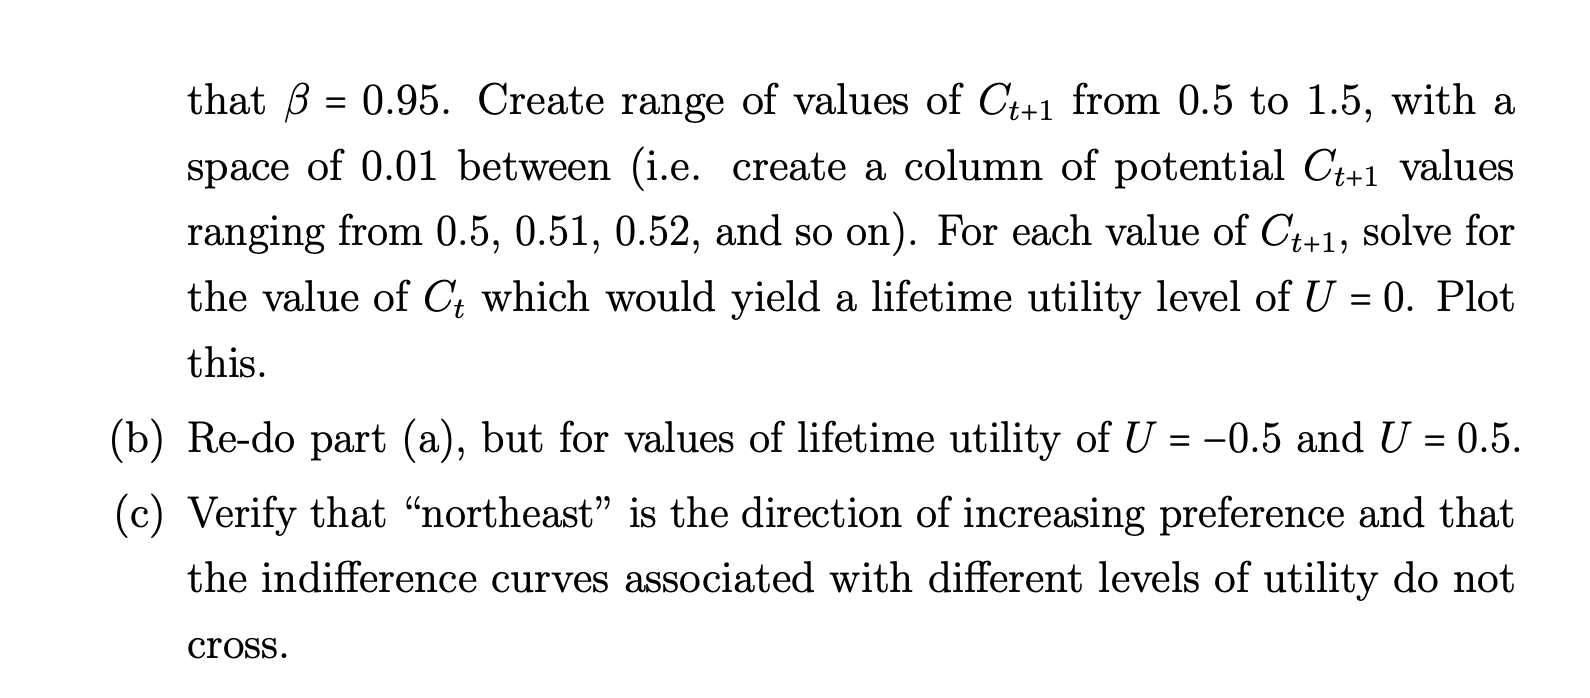
Please answer all parts and include images of worksheets from Excel. [Excel Problem] Suppose we have a household with the following lifetime utility function: U=lnCt+lnCt+1
Please answer all parts and include images of worksheets from Excel.
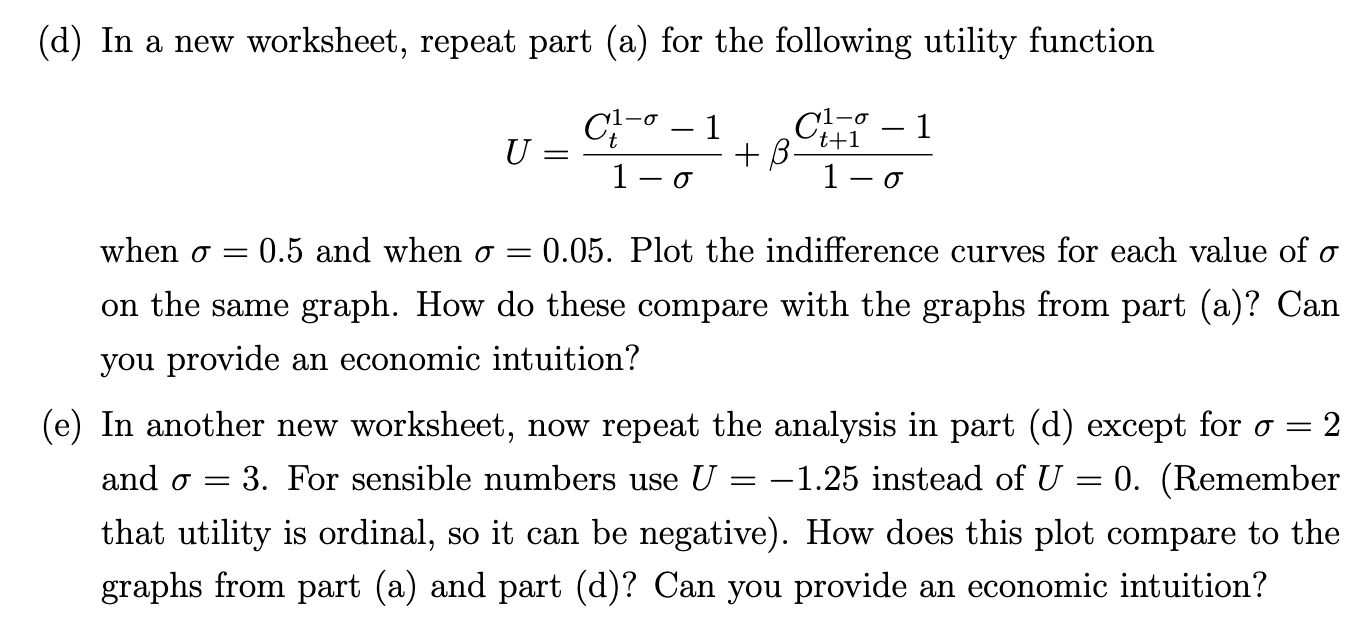
[Excel Problem] Suppose we have a household with the following lifetime utility function: U=lnCt+lnCt+1 (a) Create an Excel file to compute indifference curves numerically. Suppose that =0.95. Create range of values of Ct+1 from 0.5 to 1.5, with a space of 0.01 between (i.e. create a column of potential Ct+1 values ranging from 0.5,0.51,0.52, and so on). For each value of Ct+1, solve for the value of Ct which would yield a lifetime utility level of U=0. Plot this. b) Re-do part (a), but for values of lifetime utility of U=0.5 and U=0.5. c) Verify that "northeast" is the direction of increasing preference and that the indifference curves associated with different levels of utility do not cross. (d) In a new worksheet, repeat part (a) for the following utility function U=1Ct11+1Ct+111 when =0.5 and when =0.05. Plot the indifference curves for each value of on the same graph. How do these compare with the graphs from part (a)? Can you provide an economic intuition? (e) In another new worksheet, now repeat the analysis in part (d) except for =2 and =3. For sensible numbers use U=1.25 instead of U=0. (Remember that utility is ordinal, so it can be negative). How does this plot compare to the graphs from part (a) and part (d)? Can you provide an economic intuitionStep by Step Solution
There are 3 Steps involved in it
Step: 1
Get Instant Access to Expert-Tailored Solutions
See step-by-step solutions with expert insights and AI powered tools for academic success
Step: 2
Step: 3
Ace Your Homework with AI
Get the answers you need in no time with our AI-driven, step-by-step assistance
Get Started