Answered step by step
Verified Expert Solution
Question
1 Approved Answer
Please answer all parts, I definitely need all parts if possible, Thanks. I Definitely need the plots shown, That is the main part I am

Please answer all parts, I definitely need all parts if possible, Thanks.
I Definitely need the plots shown, That is the main part I am having trouble with.
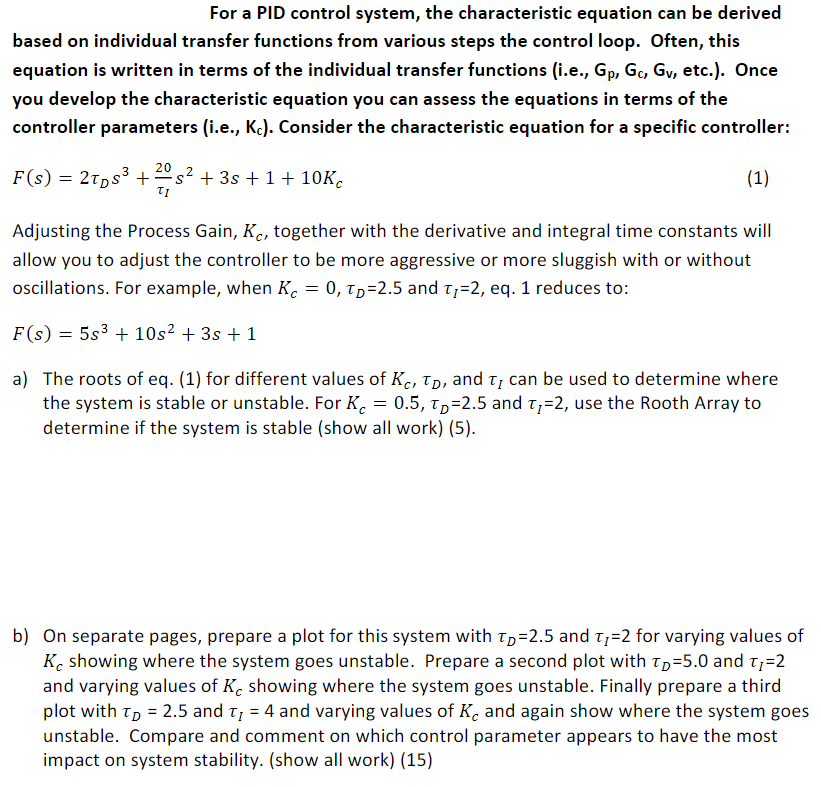
For a PID control system, the characteristic equation can be derived based on individual transfer functions from various steps the control loop. Often, this equation is written in terms of the individual transfer functions (i.e., Gp,Gc,Gv, etc.). Once you develop the characteristic equation you can assess the equations in terms of the controller parameters (i.e., Kc ). Consider the characteristic equation for a specific controller: F(s)=2Ds3+I20s2+3s+1+10Kc Adjusting the Process Gain, Kc, together with the derivative and integral time constants will allow you to adjust the controller to be more aggressive or more sluggish with or without oscillations. For example, when KC=0,D=2.5 and I=2, eq. 1 reduces to: F(s)=5s3+10s2+3s+1 a) The roots of eq. (1) for different values of KC,D, and I can be used to determine where the system is stable or unstable. For Kc=0.5,D=2.5 and I=2, use the Rooth Array to determine if the system is stable (show all work) (5). b) On separate pages, prepare a plot for this system with D=2.5 and I=2 for varying values of Kc showing where the system goes unstable. Prepare a second plot with D=5.0 and I=2 and varying values of KC showing where the system goes unstable. Finally prepare a third plot with D=2.5 and I=4 and varying values of Kc and again show where the system goes unstable. Compare and comment on which control parameter appears to have the most impact on system stability. (show all work) (15) For a PID control system, the characteristic equation can be derived based on individual transfer functions from various steps the control loop. Often, this equation is written in terms of the individual transfer functions (i.e., Gp,Gc,Gv, etc.). Once you develop the characteristic equation you can assess the equations in terms of the controller parameters (i.e., Kc ). Consider the characteristic equation for a specific controller: F(s)=2Ds3+I20s2+3s+1+10Kc Adjusting the Process Gain, Kc, together with the derivative and integral time constants will allow you to adjust the controller to be more aggressive or more sluggish with or without oscillations. For example, when KC=0,D=2.5 and I=2, eq. 1 reduces to: F(s)=5s3+10s2+3s+1 a) The roots of eq. (1) for different values of KC,D, and I can be used to determine where the system is stable or unstable. For Kc=0.5,D=2.5 and I=2, use the Rooth Array to determine if the system is stable (show all work) (5). b) On separate pages, prepare a plot for this system with D=2.5 and I=2 for varying values of Kc showing where the system goes unstable. Prepare a second plot with D=5.0 and I=2 and varying values of KC showing where the system goes unstable. Finally prepare a third plot with D=2.5 and I=4 and varying values of Kc and again show where the system goes unstable. Compare and comment on which control parameter appears to have the most impact on system stability. (show all work) (15)Step by Step Solution
There are 3 Steps involved in it
Step: 1

Get Instant Access to Expert-Tailored Solutions
See step-by-step solutions with expert insights and AI powered tools for academic success
Step: 2

Step: 3

Ace Your Homework with AI
Get the answers you need in no time with our AI-driven, step-by-step assistance
Get Started


