Please answer all questions asap
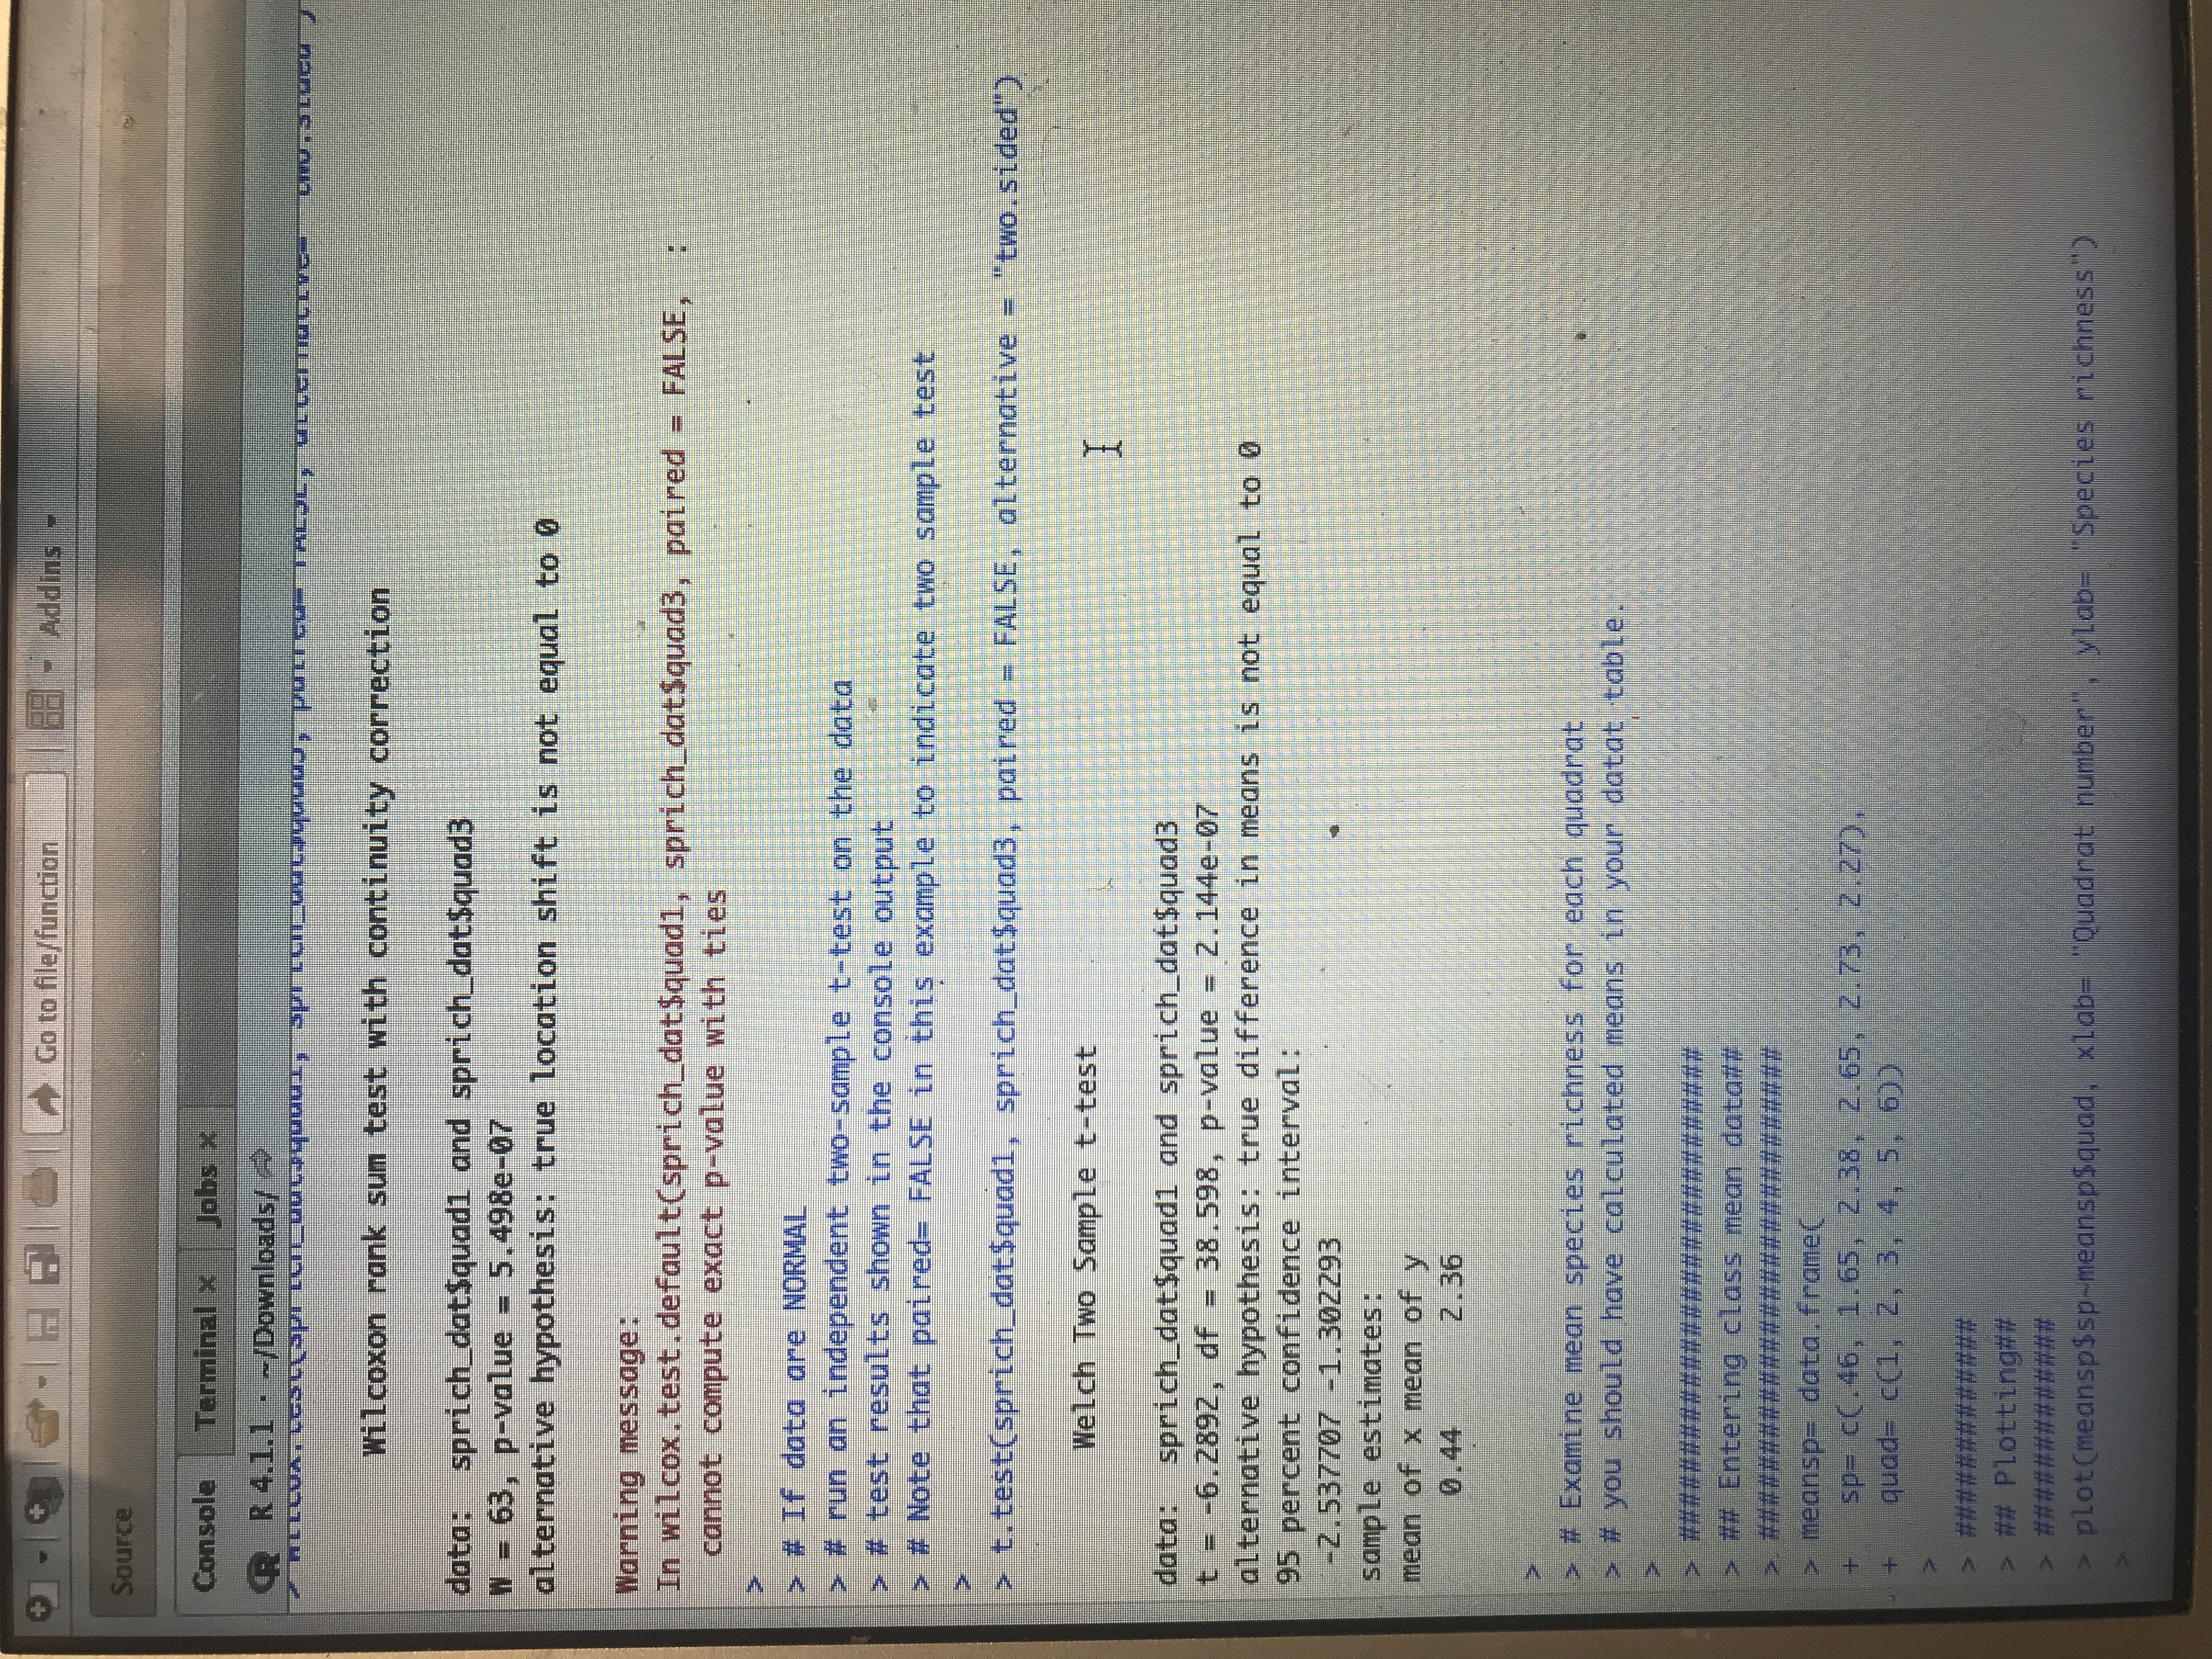
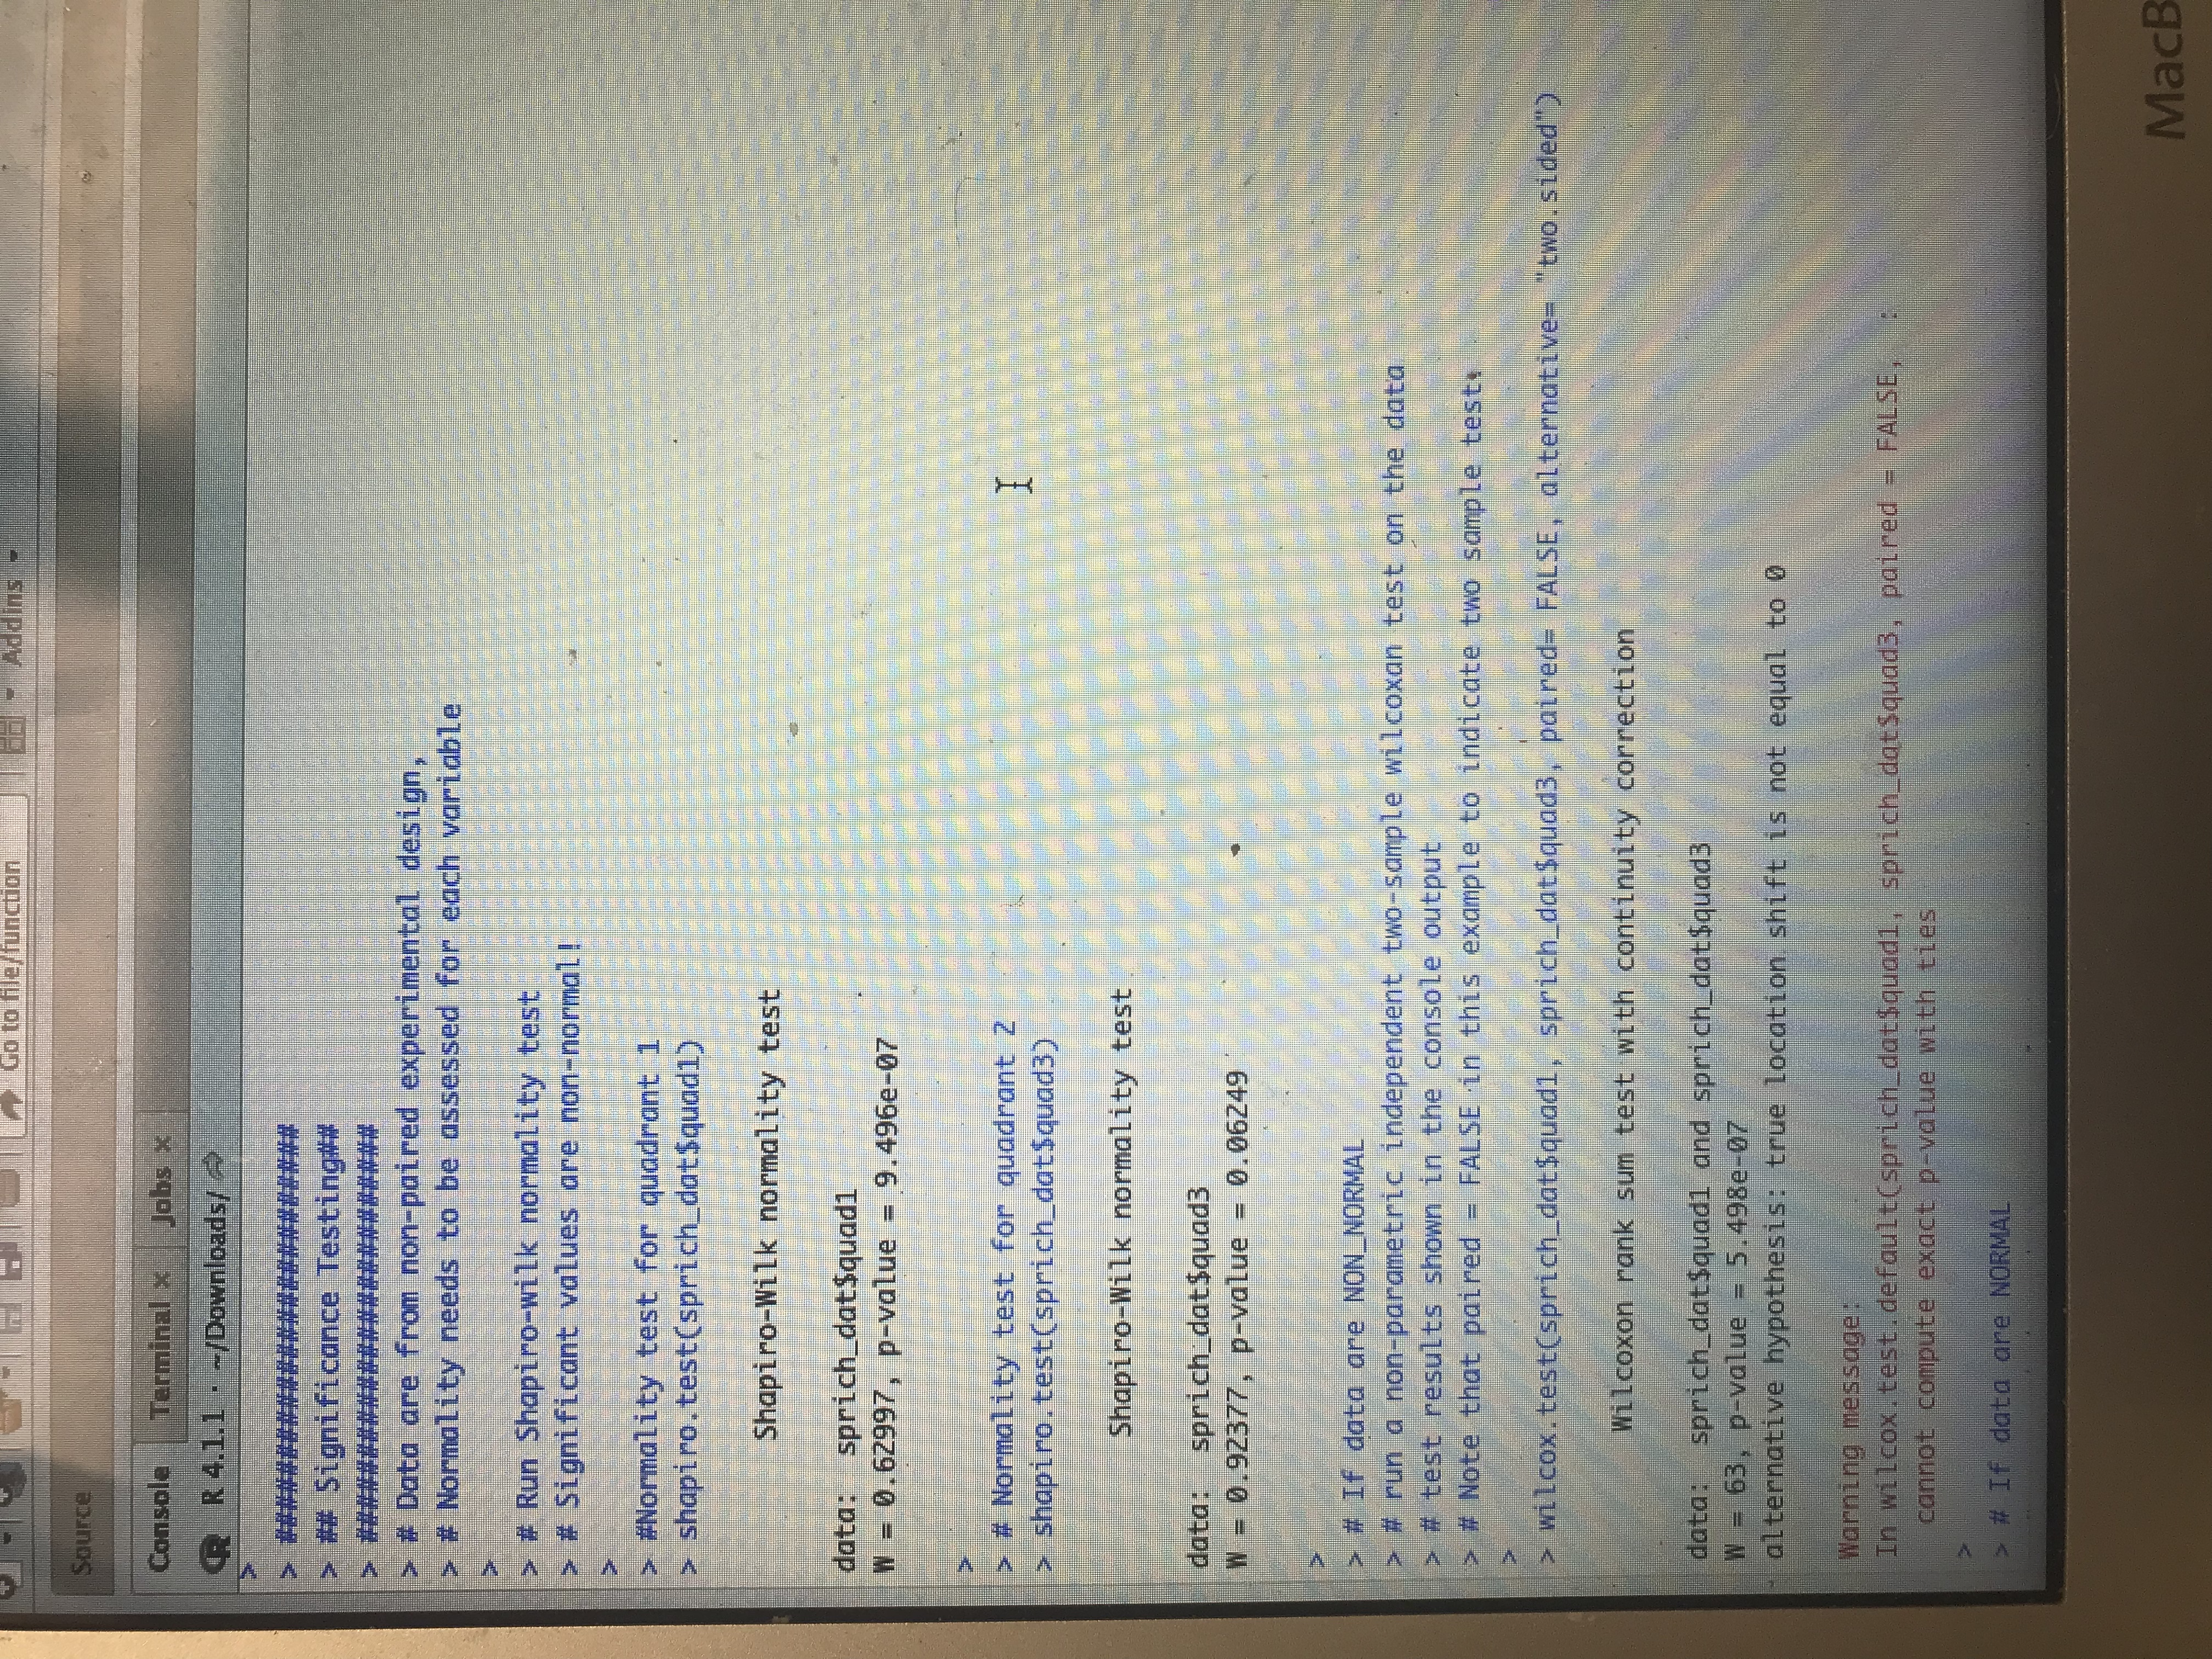
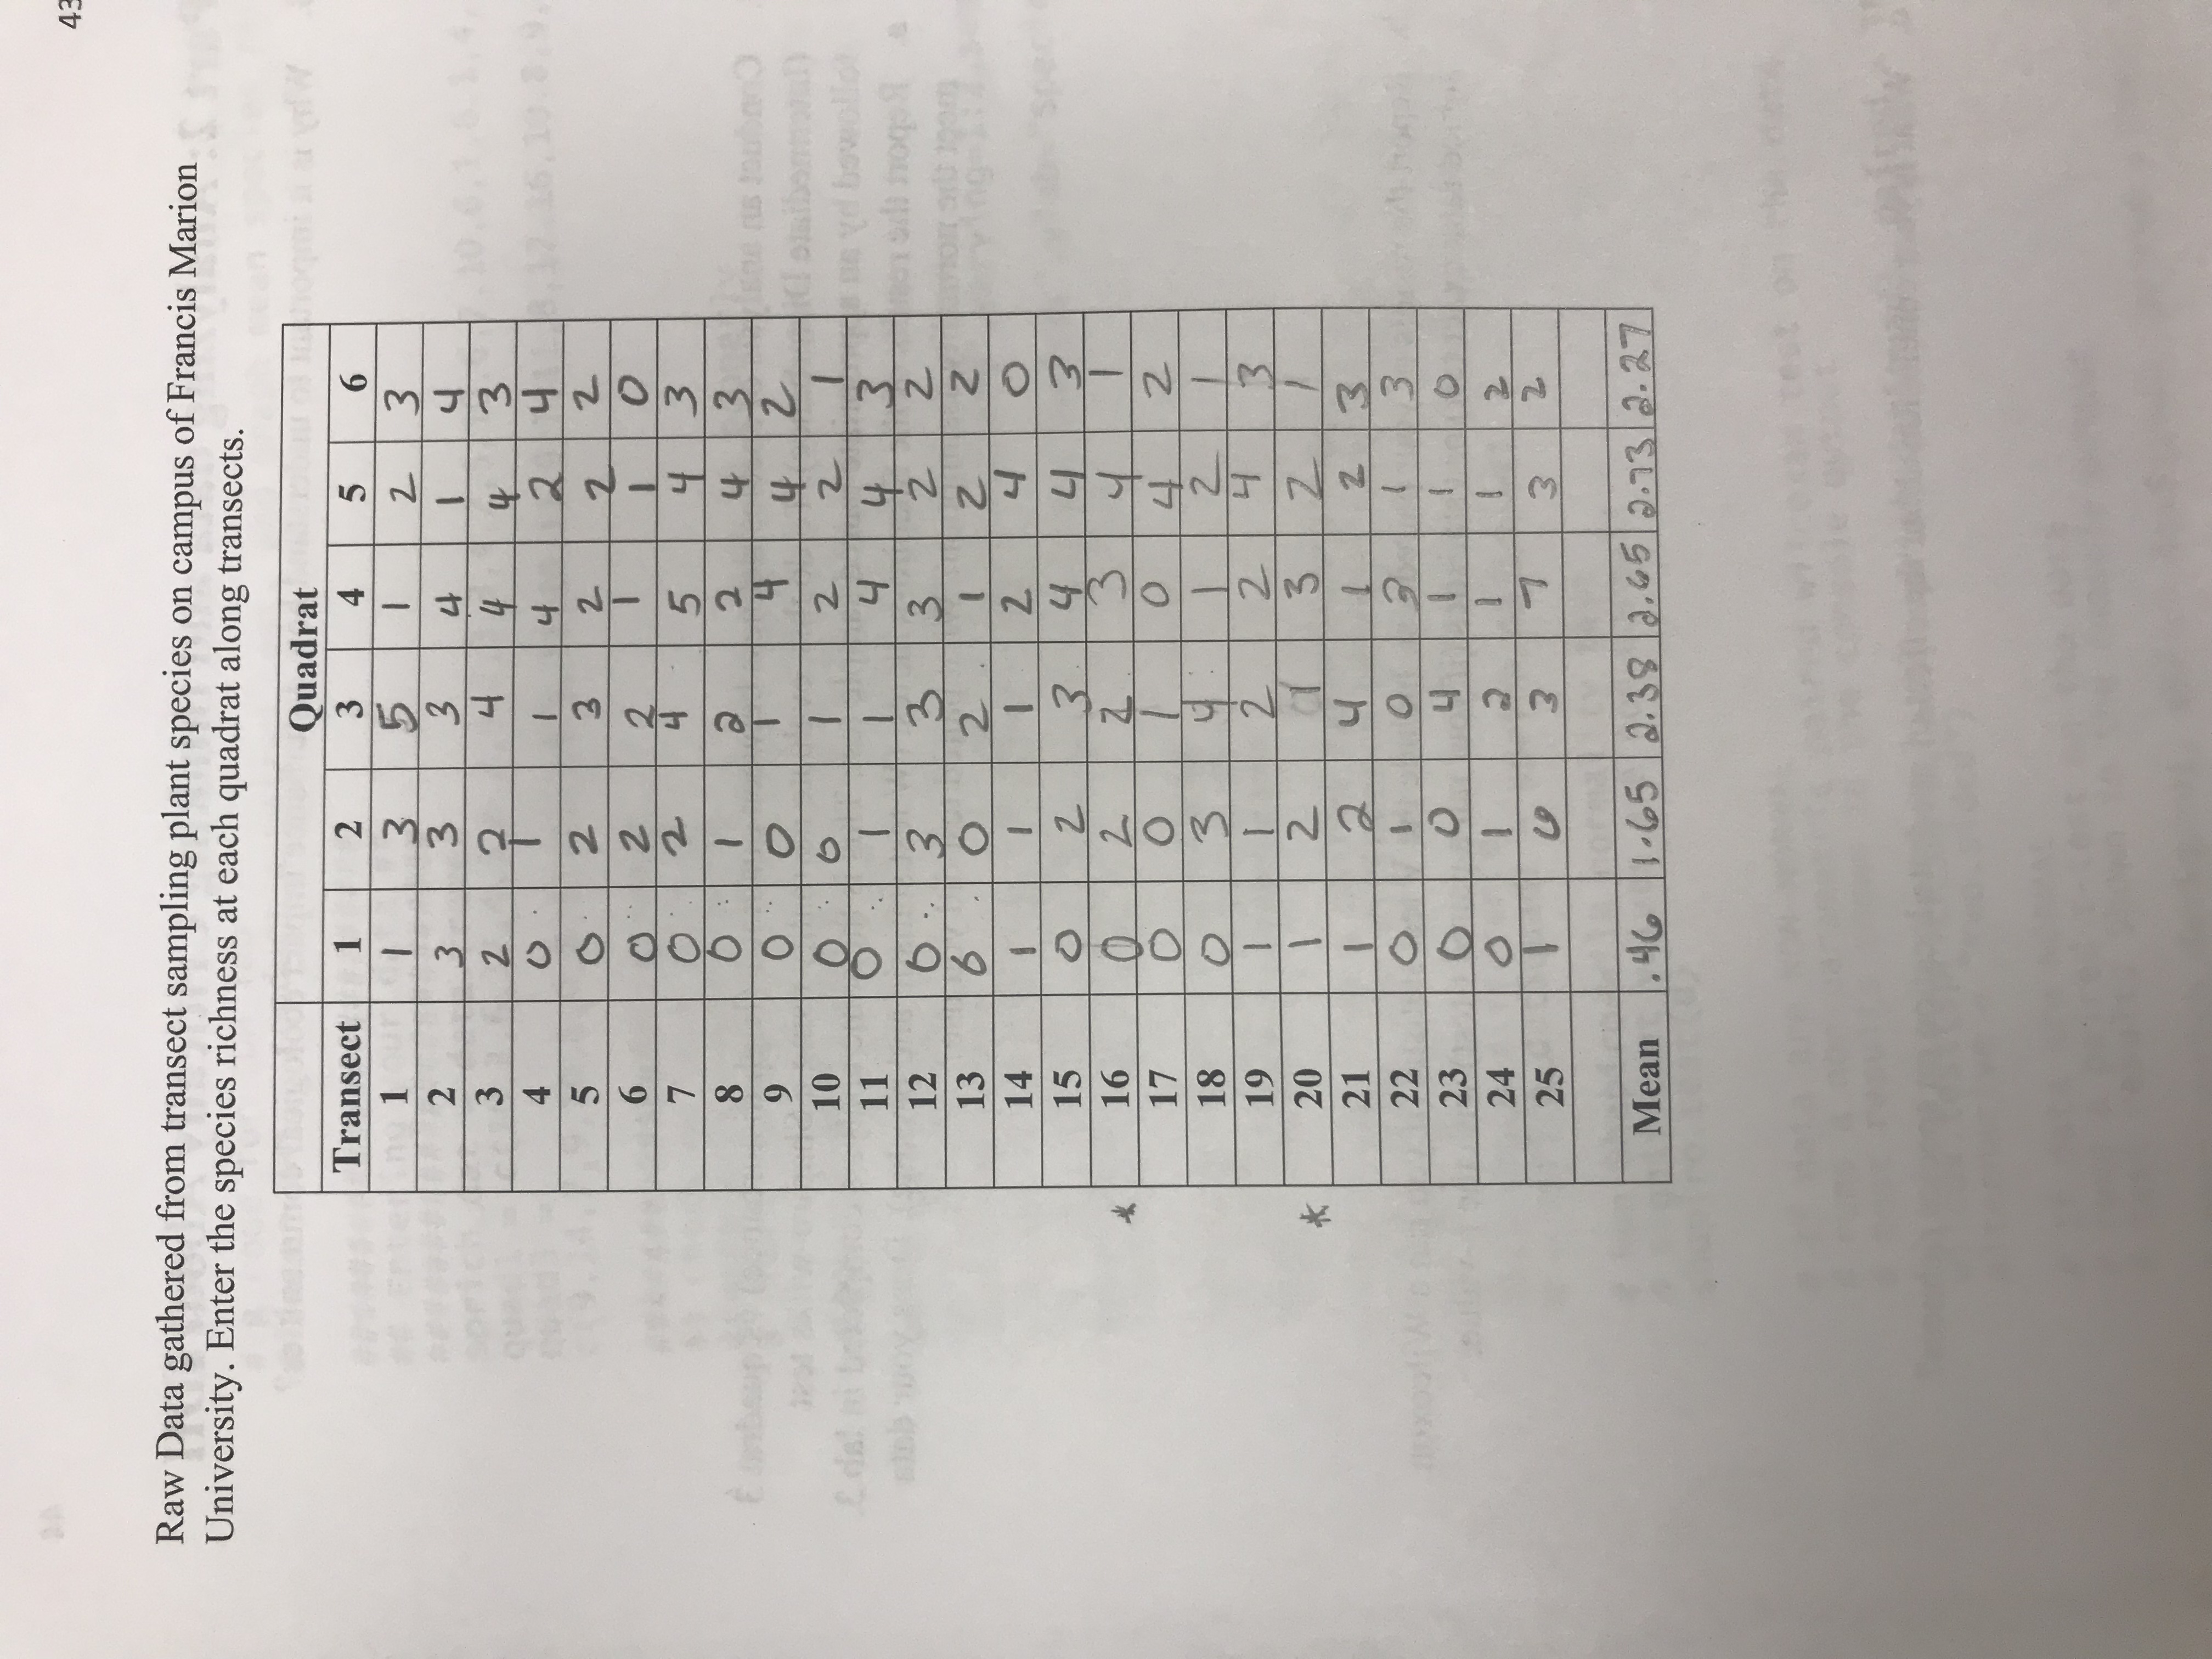
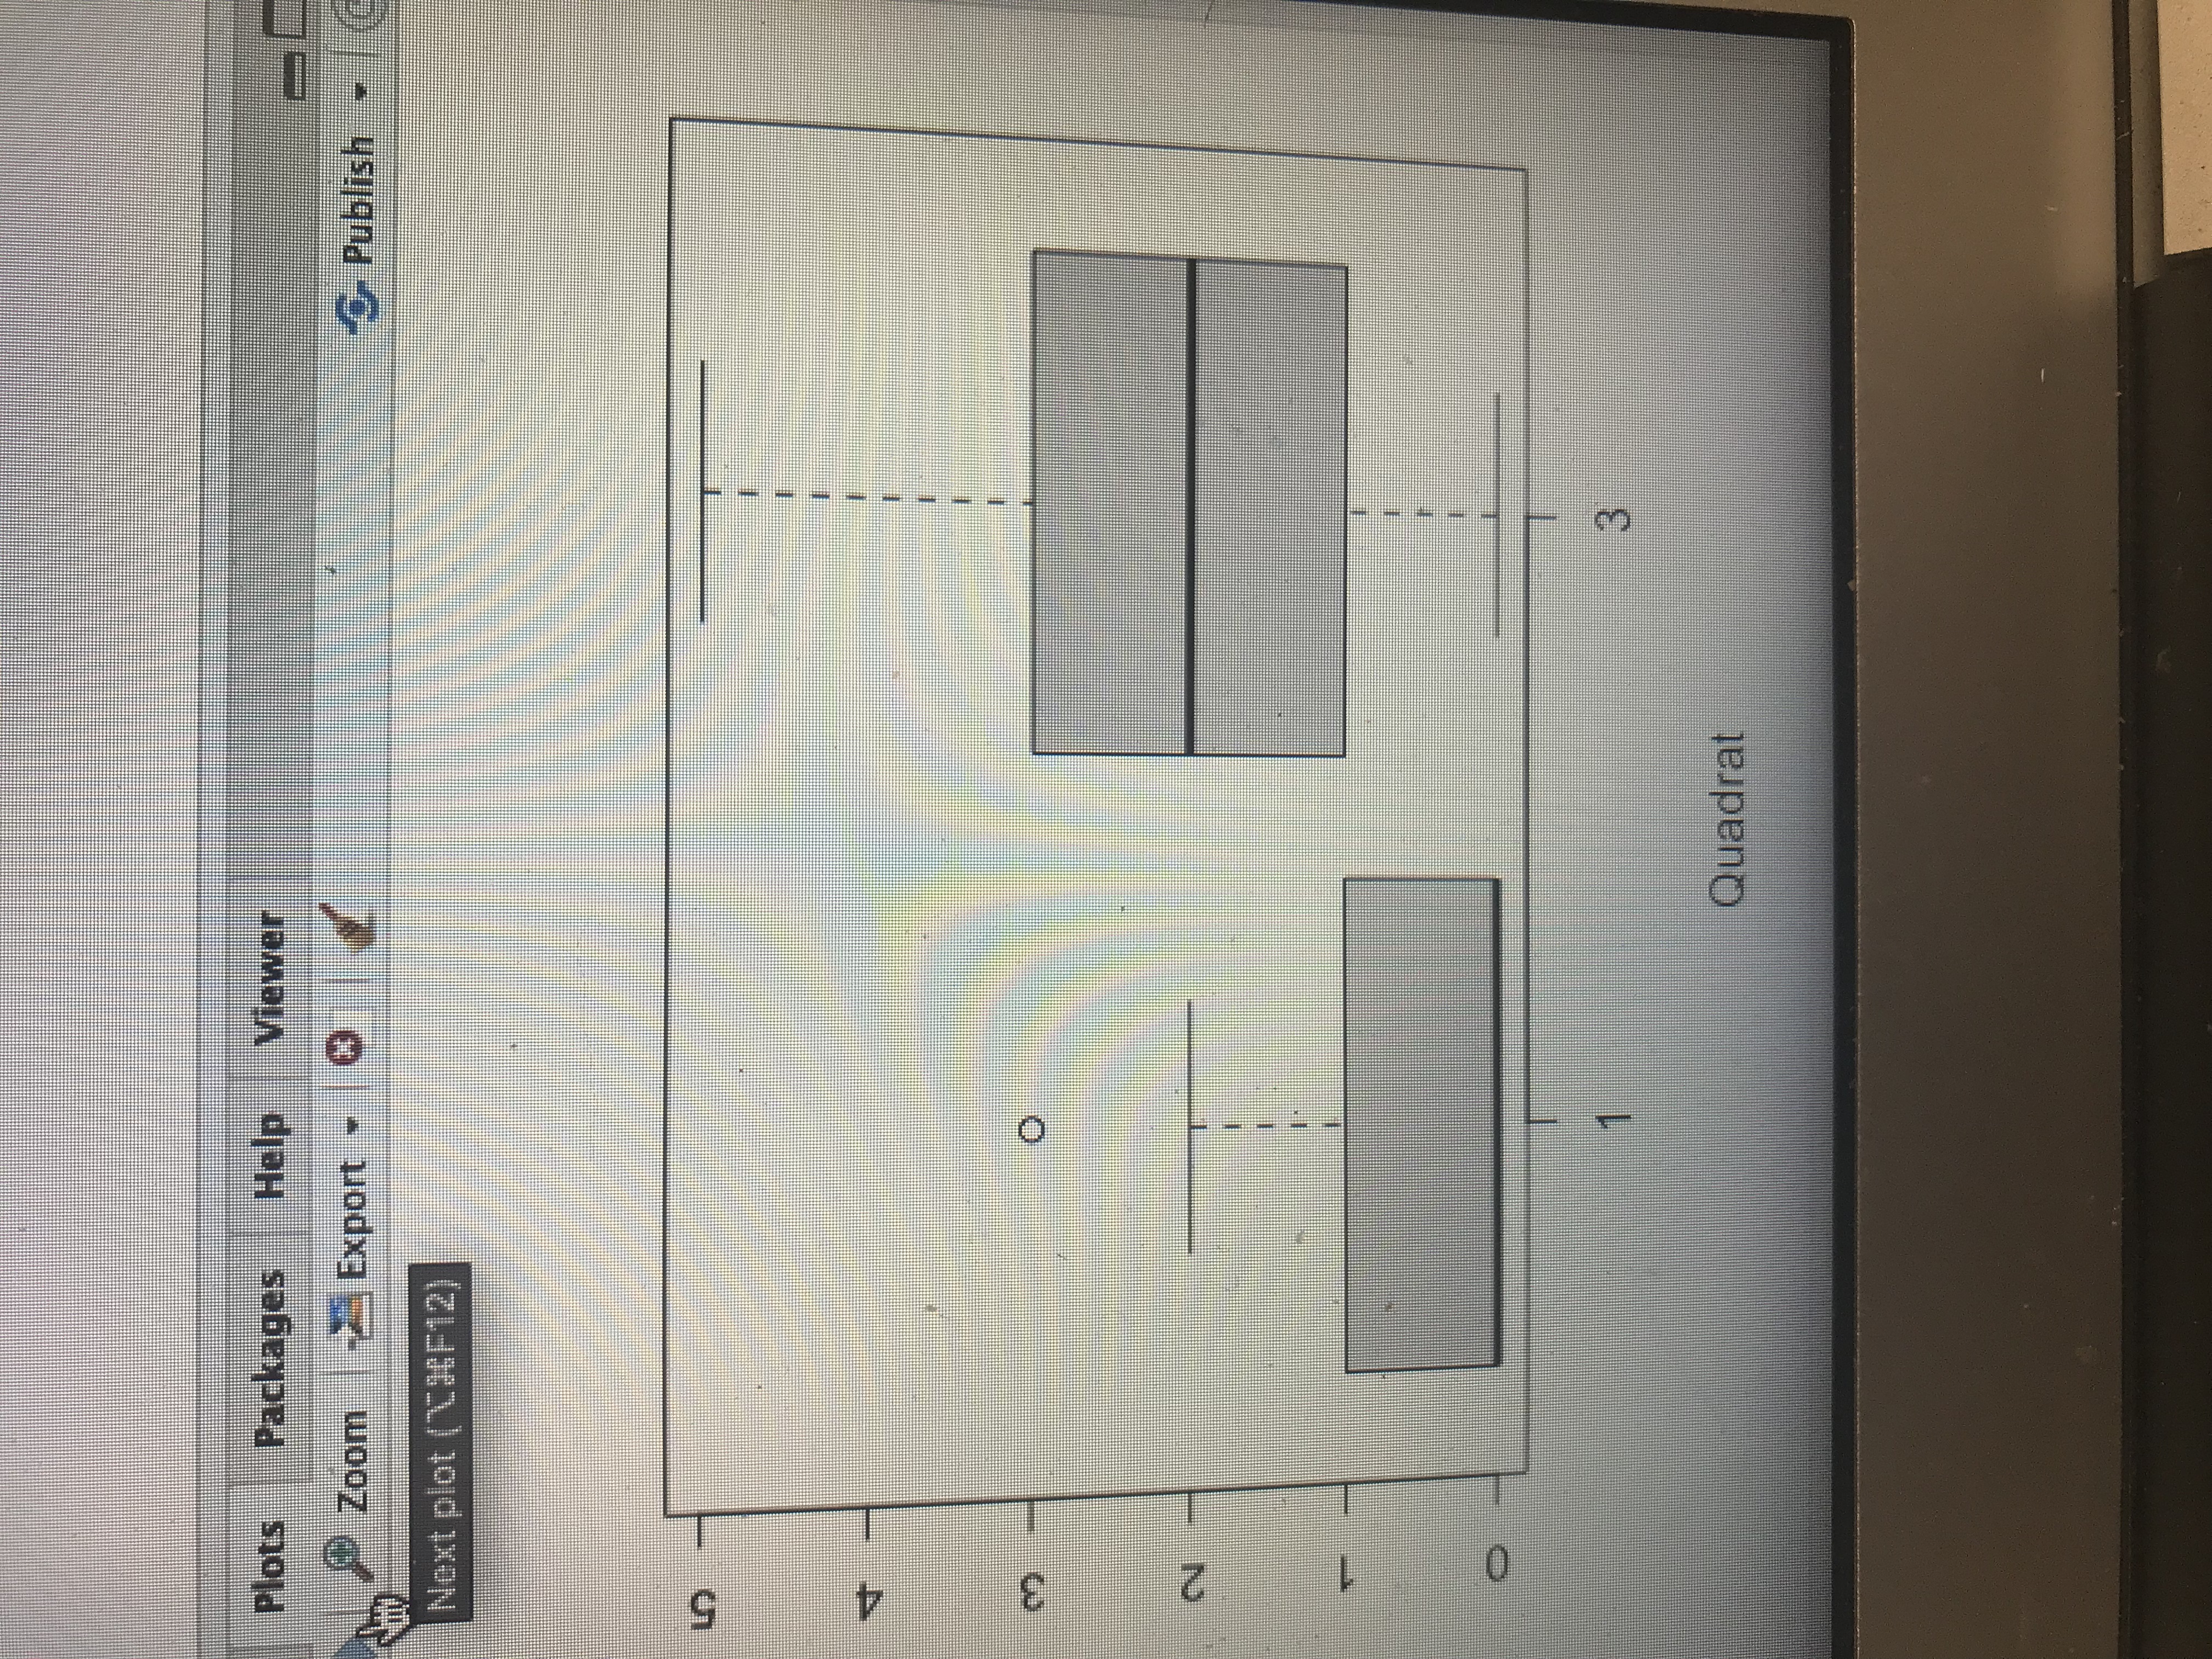
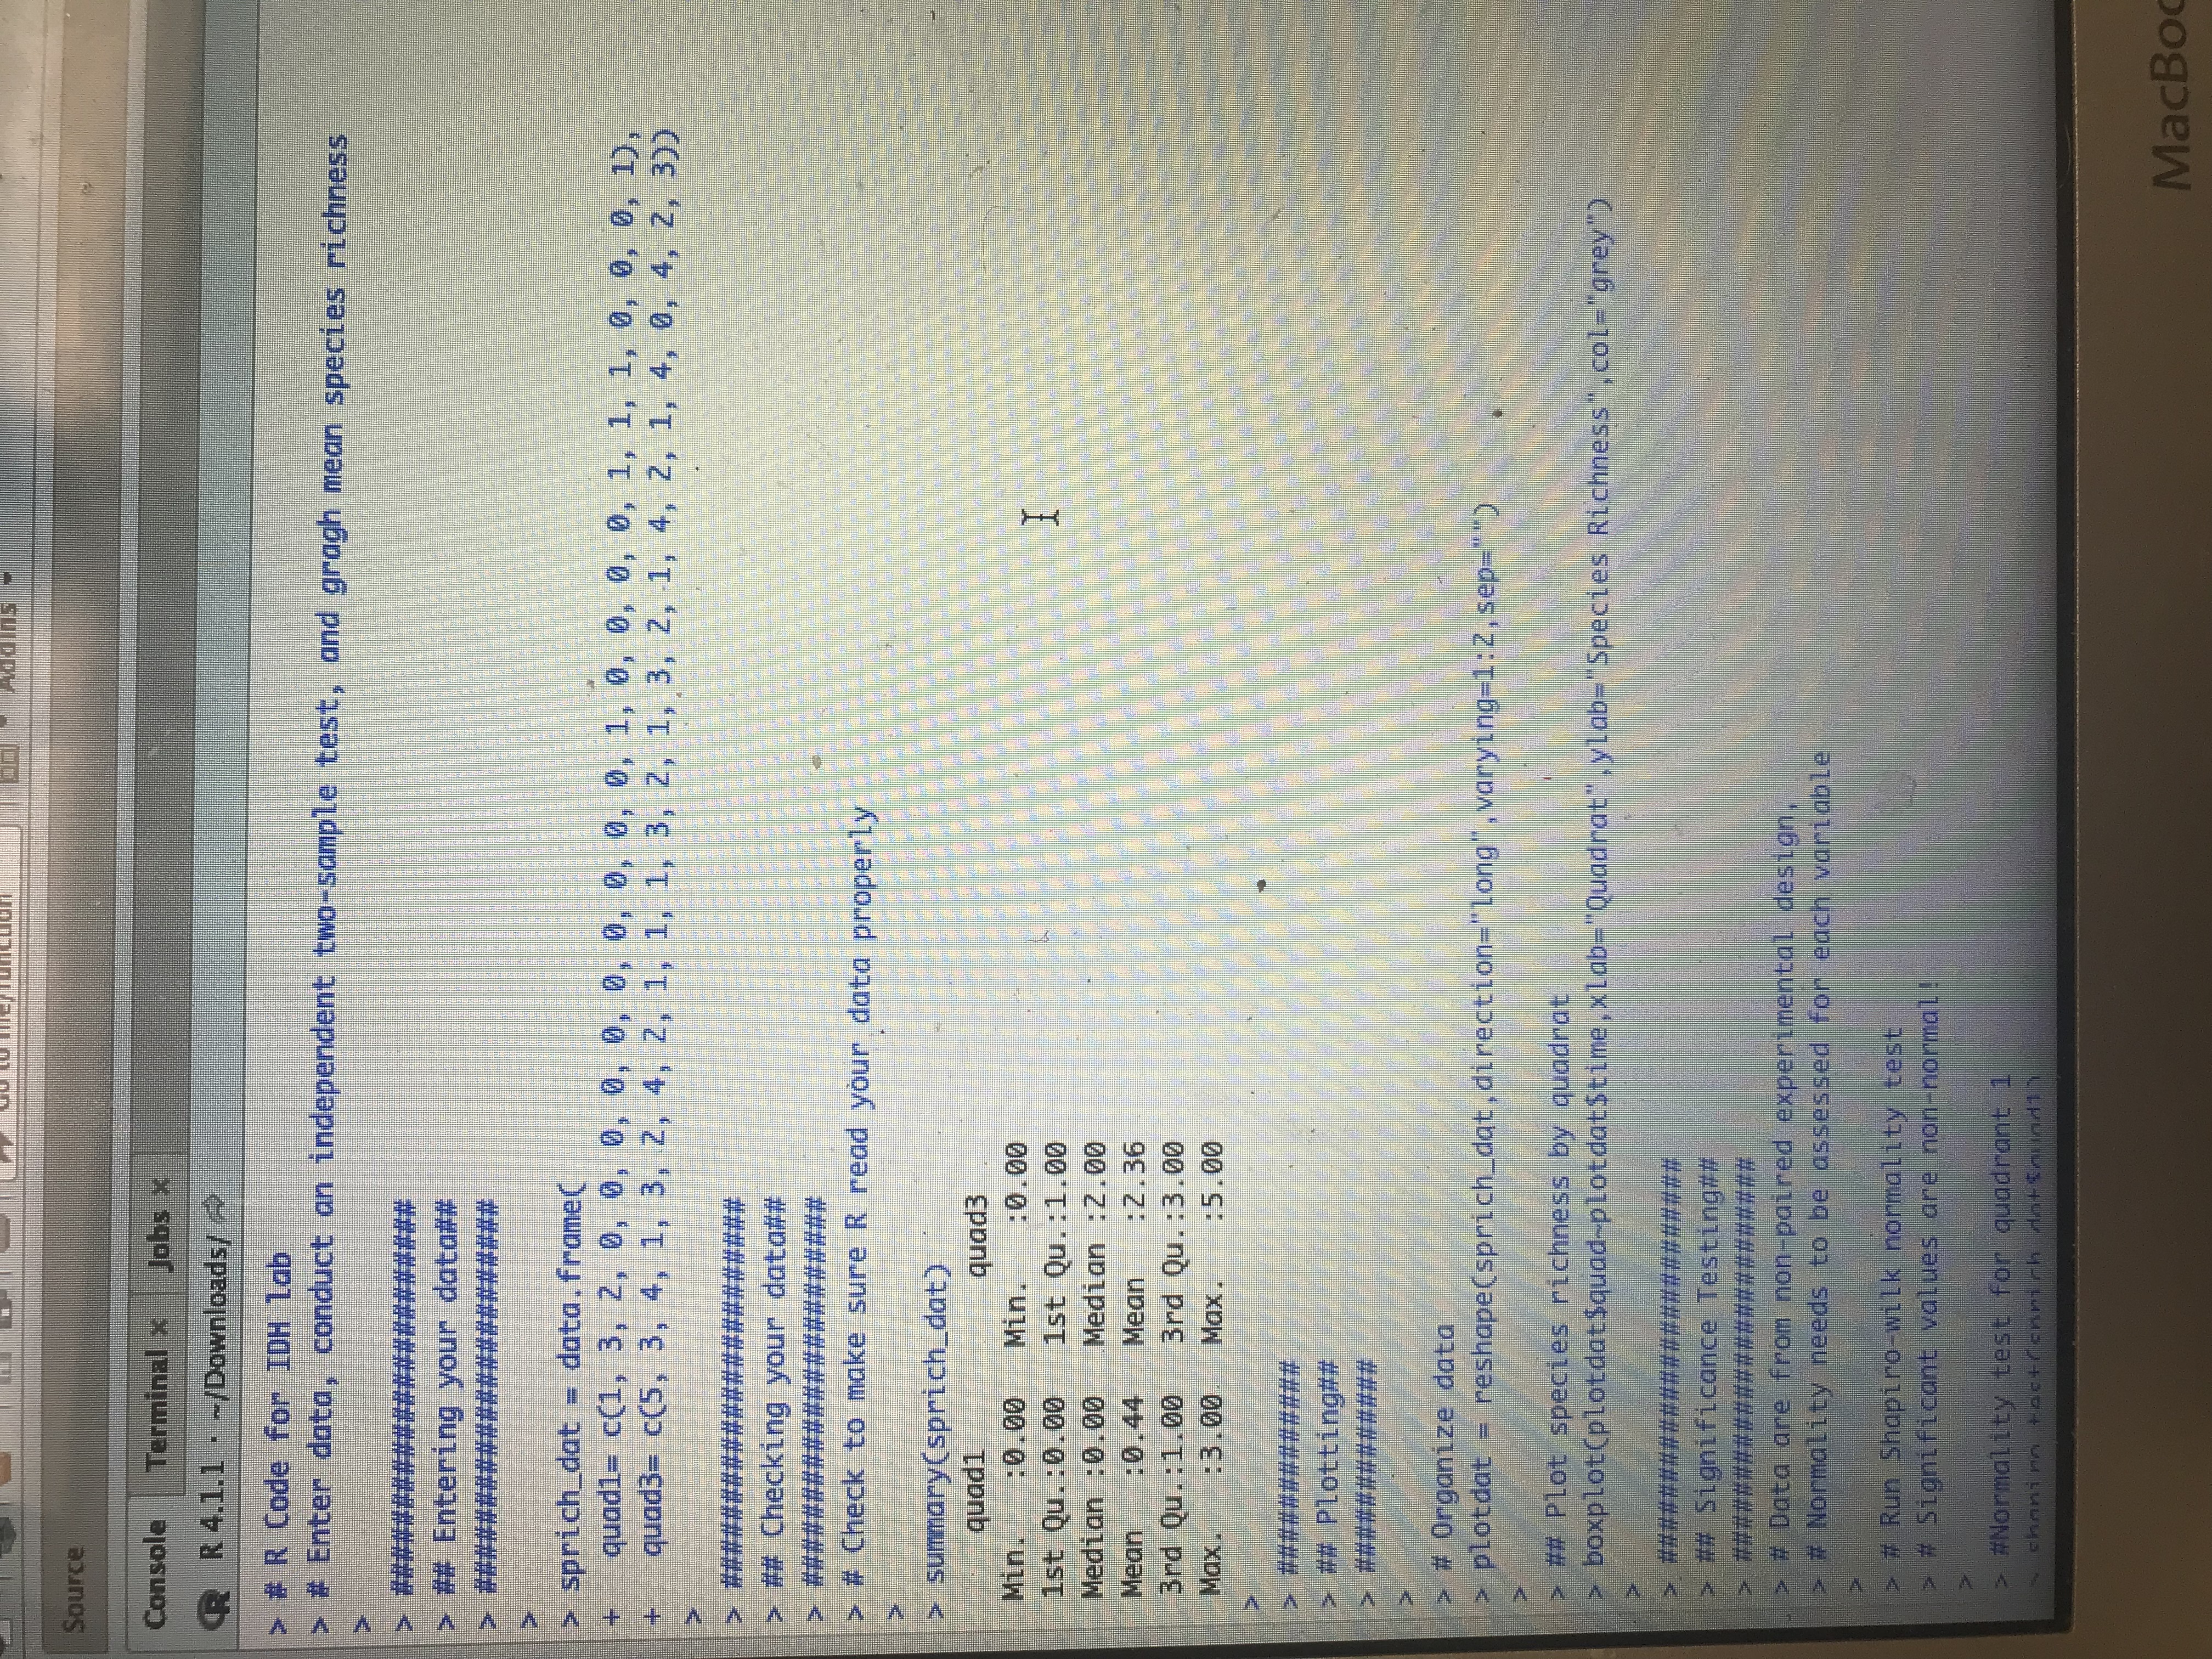
\f\fGo to hle/ function Source Console Terminal x Jobs R R 4.1.1 - -/Downloads/ ## Significance Testing## # Data are from non-paired experimental design, # Normality needs to be assessed for each variable # Run Shapiro-wilk normality test Significant values are non-normal ! #Normality test for quadrant 1 shapiro. test(sprich_datSquad1) Shapiro-Wilk normality test data: sprich_dat$quadl W = 0.62997, p-value = 9. 496e-07 > # Normality test for quadrant Z > shapiro. test(sprich_dat$quad3) Shapiro-Wilk normality test data: sprich_datSquad3 W - 0.92377, p-value = 0.06249 # If data are NON_NORMAL # run a non-parametric independent two-sample wilcoxan test on the data # test results shown in the console output # Note that paired = FALSE in this example to indicate two sample test: wilcox. test(sprich_datSquad1, sprich_datSquad3, paired- FALSE, alternative- "two. sided") Wilcoxon rank sum test with continuity correction : sprich_datSquadl and sprich_dat$quad3 W - 63, p-value - 5. 498e-07 alternative hypothesis: true location shift is not equal to o Warning message: In wilcox. test . default(sprich_datSquadl, sprich_datSquad3, paired = FALSE, cannot compute exact p-value with ties # If data are NORMAL MacB44 Part 2: Analyzing data and thinking Critically About IDH 8. Why is it important to understand how disturbance impact ecological communities? 9. Conduct an analysis of species richness between quadrat 1 (High disturbance) vs quadrat 3 (Intermediate Disturbance). To do this, evaluate normality using a Shapiro-wilks test followed by an appropriate paired sample test. This is the same analysis completed in lab 3. a. Report the results of the Shapiro-wilk test (W test statistic and p-value). Does your data meet the normality assumption? What paired test did you use? b. Report the results of your paired test. Include the V test statistic (if you ran a Wilcoxon signed rank exact test) or t statistics (if your ran a paired t-test) with the p-value. c. What is your conclusion about the effect of quadrate location on species richness?Raw Data gathered from transect sampling plant species on campus of Francis Marion University. Enter the species richness at each quadrat along transects. Quadrat Transect 1 5 6 1 2 .10.3.9. -U IN W - I W /w O W - O O - N N N N WW N oo oo ooo CQ CNW E onbeup 10 -W / N -WON NW - NW W O N I W/ CW 11 as yd bowollon 12 13 J - - W - W N OWS N - W IN NI - NC F f - 14 15 16 17 - - -0 09 0 - - J N- WONN- 18 19 20 21 22 O 23 0 NNO WW 24 0 -1 25 3 Mean . 46 1-65| 2. 38 2. 65 2.73 2. 27Plots Packages Help Viewer Zoom Export - Publish Next plot ("CO(F12) O N O 3 Quadrat\f
