!!!!!!!!PLEASE ANSWER ALL QUESTIONS IN AN EXPLANATORY FORM!!!!!!!
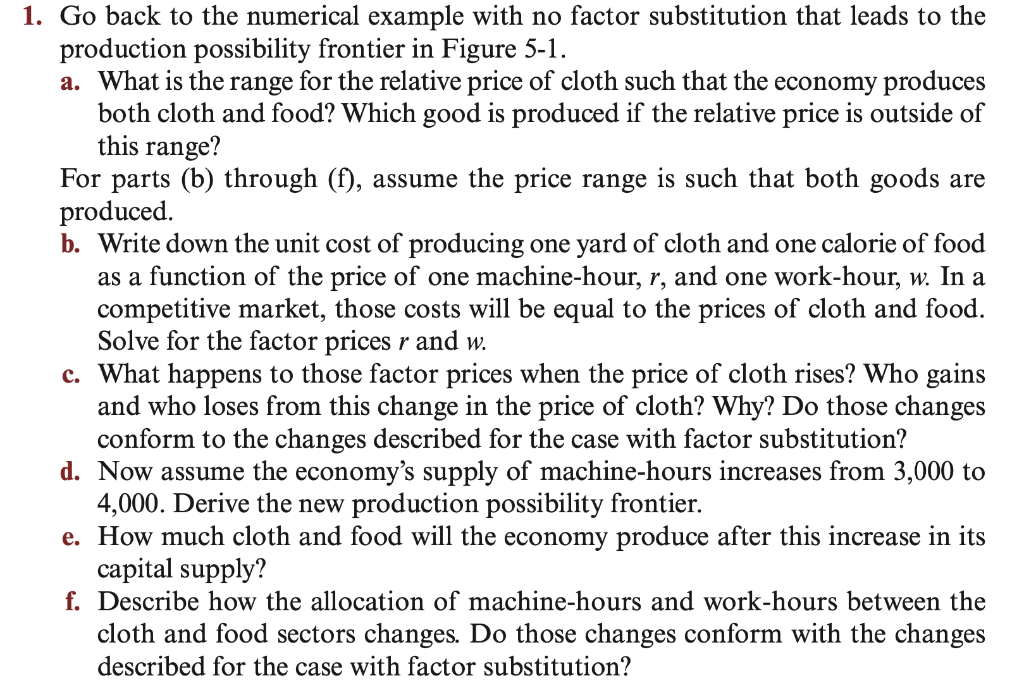
Go back to the numerical example with no factor substitution that leads to the production possibility frontier in Figure 5-1. a. What s the range for the relative price of cloth such that the Economy produces both cloth and food? Which good is produced if the relative price is outside of this range? For parts (b) through (f), assume the price range is such that both goods are produced. b. Write down the unit cost of producing one yard of cloth and one calorie of food as a function of the price of one machine-hour, r, and one work-hour, w. In a competitive market, those costs will be equal to the prices of cloth and food. Solve for the factor prices r and w. c. What happens to those factor prices when the price of cloth rises? Who gains and who loses from this change in the price of cloth? Why? Do those changes conform to the changes described for the case with factor substitution? d. Now assume the economys supply of machine-hours increases from 3,000 to 4,000. Derive the new production possibility frontier. e. How much cloth and food will the economy produce after this increase in its capital supply? f. Describe how the allocation of machine-hours and work-hours between the cloth and food sectors changes. Do those changes conform with the changes described for the case with factor substitution?

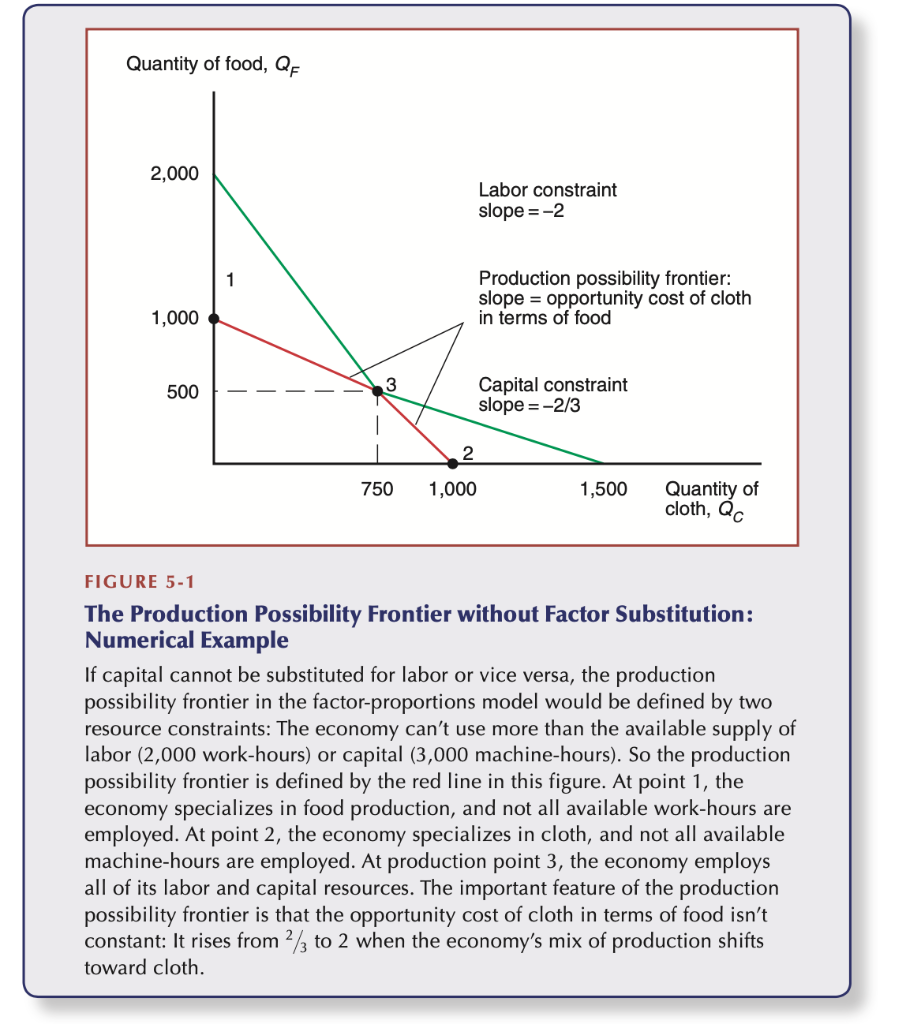
FIGURE 5-1 The Production Possibility Frontier without Factor Substitution: Numerical Example If capital cannot be substituted for labor or vice versa, the production possibility frontier in the factor-proportions model would be defined by two resource constraints: The economy can't use more than the available supply of labor (2,000 work-hours) or capital (3,000 machine-hours). So the production possibility frontier is defined by the red line in this figure. At point 1 , the economy specializes in food production, and not all available work-hours are employed. At point 2, the economy specializes in cloth, and not all available machine-hours are employed. At production point 3, the economy employs all of its labor and capital resources. The important feature of the production possibility frontier is that the opportunity cost of cloth in terms of food isn't constant: It rises from 2/3 to 2 when the economy's mix of production shifts toward cloth. 1. Go back to the numerical example with no factor substitution that leads to the production possibility frontier in Figure 51. a. What is the range for the relative price of cloth such that the economy produces both cloth and food? Which good is produced if the relative price is outside of this range? For parts (b) through (f), assume the price range is such that both goods are produced. b. Write down the unit cost of producing one yard of cloth and one calorie of food as a function of the price of one machine-hour, r, and one work-hour, w. In a competitive market, those costs will be equal to the prices of cloth and food. Solve for the factor prices r and w. c. What happens to those factor prices when the price of cloth rises? Who gains and who loses from this change in the price of cloth? Why? Do those changes conform to the changes described for the case with factor substitution? d. Now assume the economy's supply of machine-hours increases from 3,000 to 4,000. Derive the new production possibility frontier. e. How much cloth and food will the economy produce after this increase in its capital supply? f. Describe how the allocation of machine-hours and work-hours between the cloth and food sectors changes. Do those changes conform with the changes described for the case with factor substitution? FIGURE 5-1 The Production Possibility Frontier without Factor Substitution: Numerical Example If capital cannot be substituted for labor or vice versa, the production possibility frontier in the factor-proportions model would be defined by two resource constraints: The economy can't use more than the available supply of labor (2,000 work-hours) or capital (3,000 machine-hours). So the production possibility frontier is defined by the red line in this figure. At point 1 , the economy specializes in food production, and not all available work-hours are employed. At point 2, the economy specializes in cloth, and not all available machine-hours are employed. At production point 3, the economy employs all of its labor and capital resources. The important feature of the production possibility frontier is that the opportunity cost of cloth in terms of food isn't constant: It rises from 2/3 to 2 when the economy's mix of production shifts toward cloth. 1. Go back to the numerical example with no factor substitution that leads to the production possibility frontier in Figure 51. a. What is the range for the relative price of cloth such that the economy produces both cloth and food? Which good is produced if the relative price is outside of this range? For parts (b) through (f), assume the price range is such that both goods are produced. b. Write down the unit cost of producing one yard of cloth and one calorie of food as a function of the price of one machine-hour, r, and one work-hour, w. In a competitive market, those costs will be equal to the prices of cloth and food. Solve for the factor prices r and w. c. What happens to those factor prices when the price of cloth rises? Who gains and who loses from this change in the price of cloth? Why? Do those changes conform to the changes described for the case with factor substitution? d. Now assume the economy's supply of machine-hours increases from 3,000 to 4,000. Derive the new production possibility frontier. e. How much cloth and food will the economy produce after this increase in its capital supply? f. Describe how the allocation of machine-hours and work-hours between the cloth and food sectors changes. Do those changes conform with the changes described for the case with factor substitution


