Answered step by step
Verified Expert Solution
Link Copied!

Question

1 Approved Answer

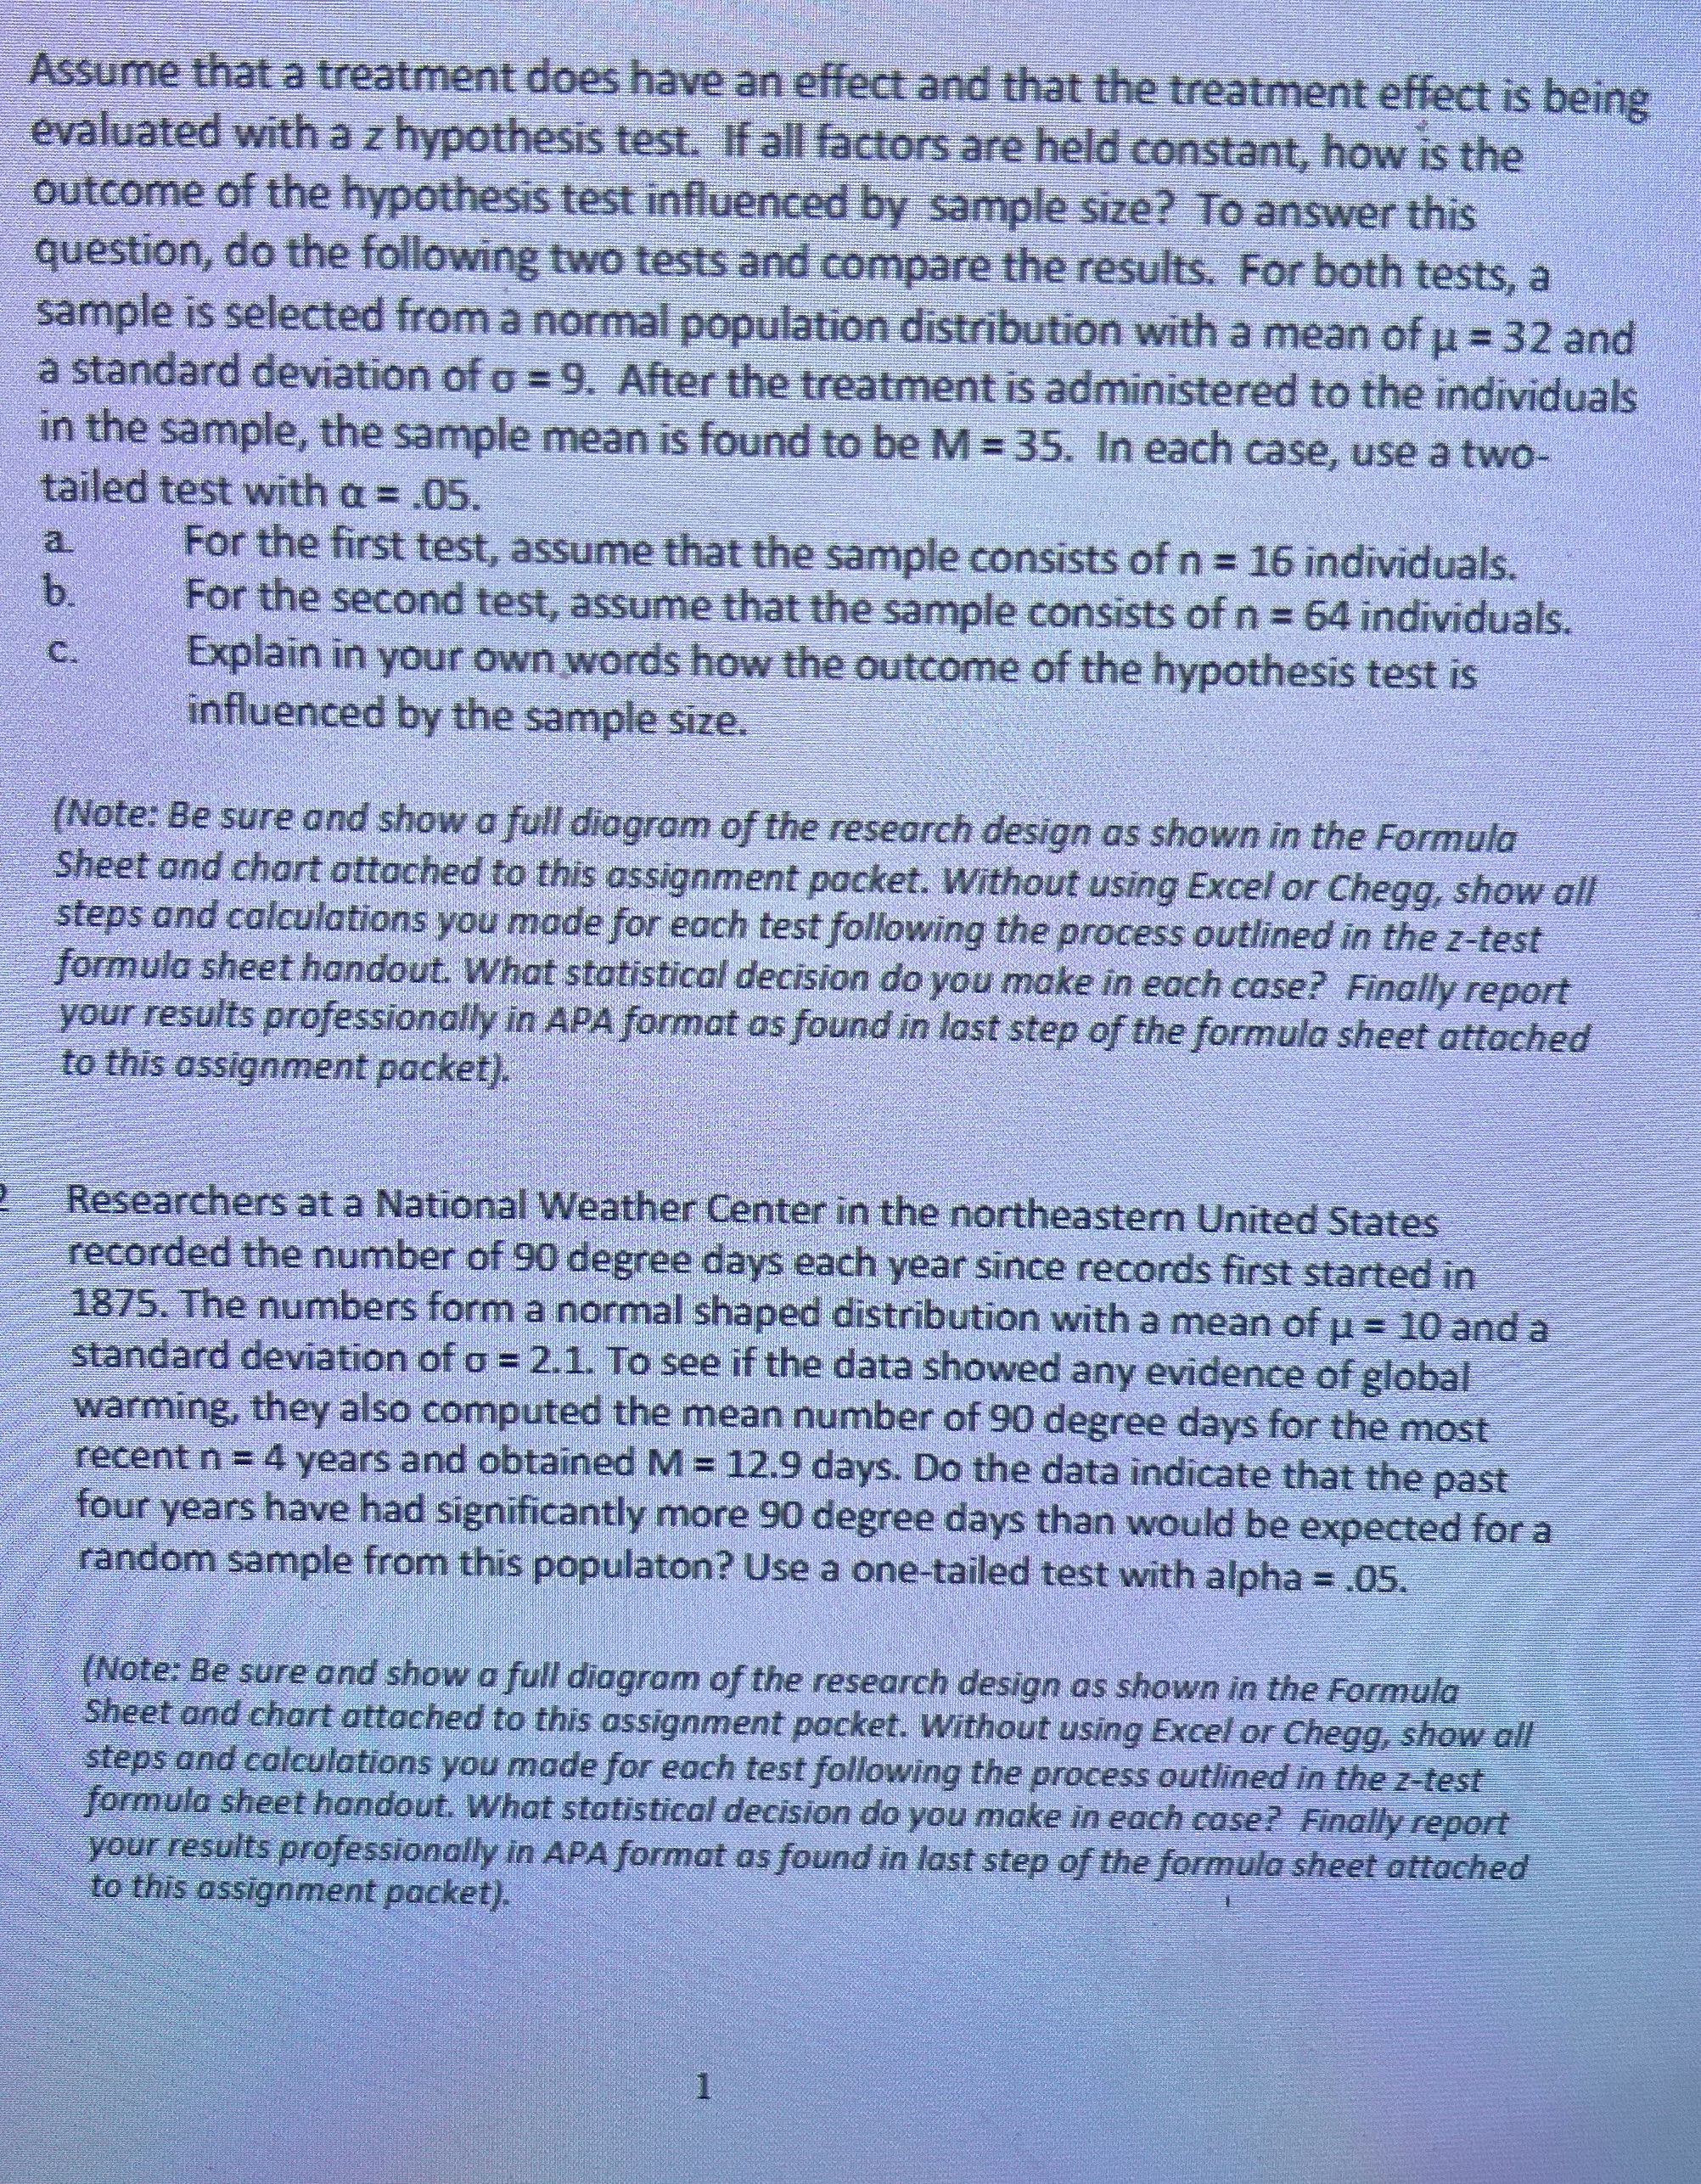
please answer all questions. thank you Assume that a treatment does have an effect and that the treatment effect is being evaluated with a z

please answer all questions. thank you

image text in transcribed
Assume that a treatment does have an effect and that the treatment effect is being evaluated with a z hypothesis test. If all factors are held constant, how is the outcome of the hypothesis test influenced by sample size? To answer this question, do the following two tests and compare the results. For both tests, a sample is selected from a normal population distribution with a mean of u = 32 and a standard deviation of o = 9. After the treatment is administered to the individuals in the sample, the sample mean is found to be M = 35. In each case, use a two- tailed test with a = .05. For the first test, assume that the sample consists of n = 16 individuals. For the second test, assume that the sample consists of n = 64 individuals. Explain in your own words how the outcome of the hypothesis test is influenced by the sample size. (Note: Be sure and show a full diagram of the research design as shown in the Formula Sheet and chart attached to this assignment packet. Without using Excel or Chegg, show all steps and calculations you made for each test following the process outlined in the z-test formula sheet handout. What statistical decision do you make in each case? Finally report your results professionally in APA format as found in last step of the formula sheet attached to this assignment packet). Researchers at a National Weather Center in the northeastern United States recorded the number of 90 degree days each year since records first started in 875. The numbers form a normal shaped distribution with a mean of u = 10 and a standard deviation of o = 2.1. To see if the data showed any evidence of global warming, they also computed the mean number of 90 degree days for the most recent n = 4 years and obtained M = 12.9 days. Do the data indicate that the past four years have had significantly more 90 degree days than would be expected for a random sample from this populaton? Use a one-tailed test with alpha = .05. (Note: Be sure and show a full diagram of the research design as shown in the Formula Sheet and chart attached to this assignment packet. Without using Excel or Chegg, show all steps and calculations you made for each test following the process outlined in the z-test formula sheet handout. What statistical decision do you make in each case? Finally report your results professionally in APA format as found in last step of the formula sheet attached to this assignment packet)

Step by Step Solution

There are 3 Steps involved in it

Step: 1

blur-text-image

Get Instant Access to Expert-Tailored Solutions

See step-by-step solutions with expert insights and AI powered tools for academic success

Step: 2

blur-text-image

Step: 3

blur-text-image

Ace Your Homework with AI

Get the answers you need in no time with our AI-driven, step-by-step assistance

Get Started

Recommended Textbook for

Elementary Linear Algebra

Authors: Ron Larson

8th Edition

1305877020, 9781305877023

More Books

Students also viewed these Mathematics questions

Question

What reward will you give yourself when you achieve this?

Answered: 1 week ago