Please answer all the questions for a thumbs up :) 1) Which ofthe following statements is true regarding long-run growth in China? a. b. China
Please answer all the questions for a thumbs up :)
1)
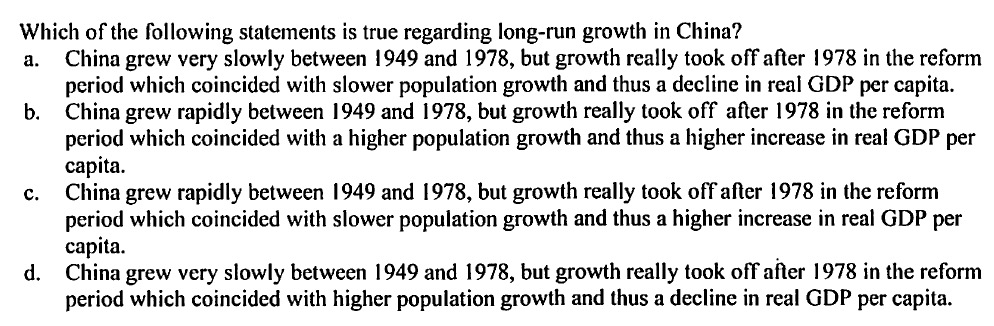
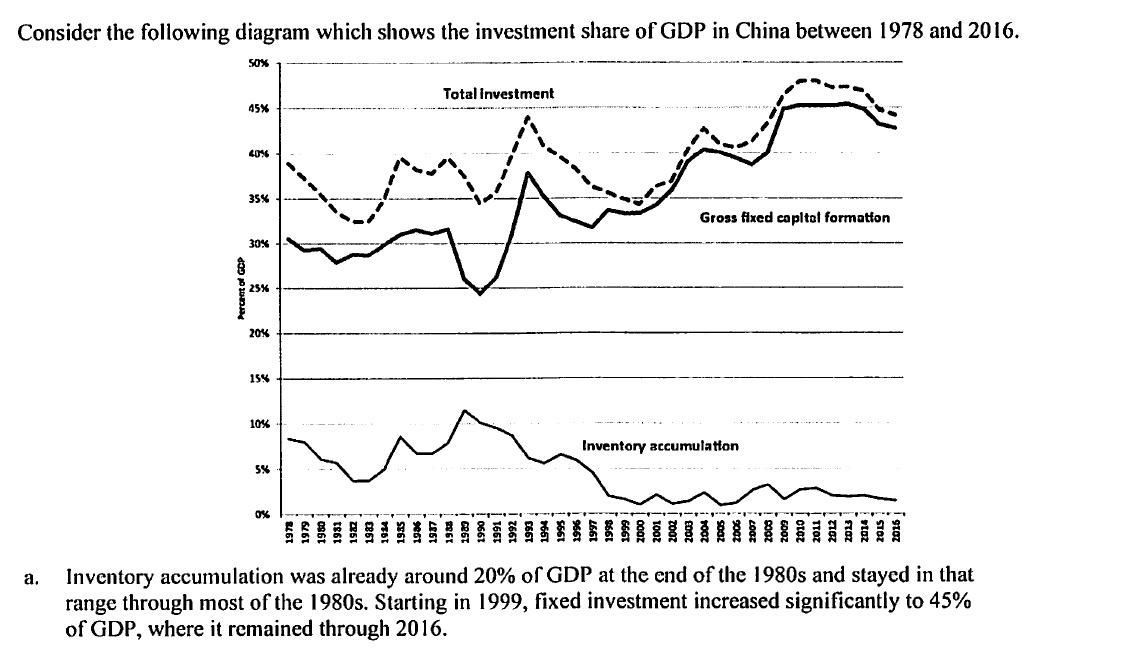
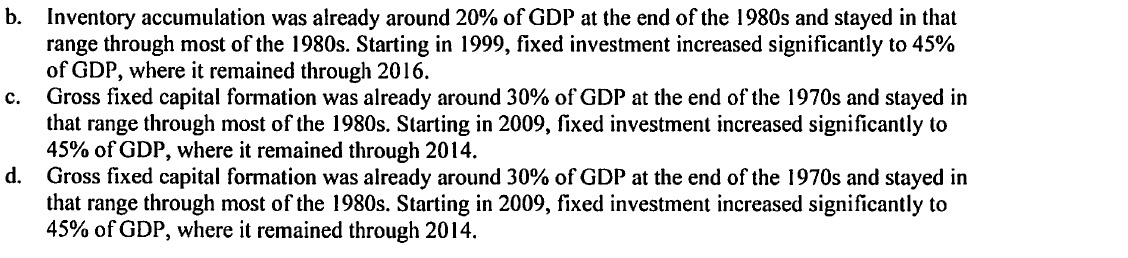
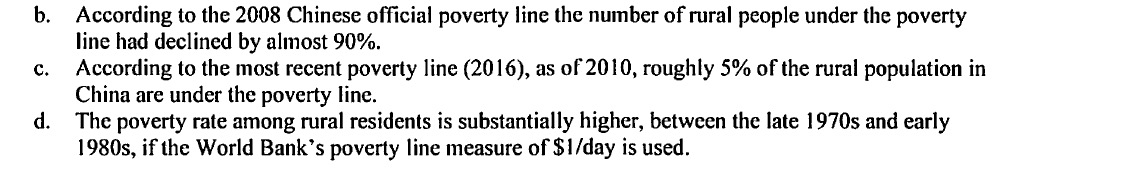
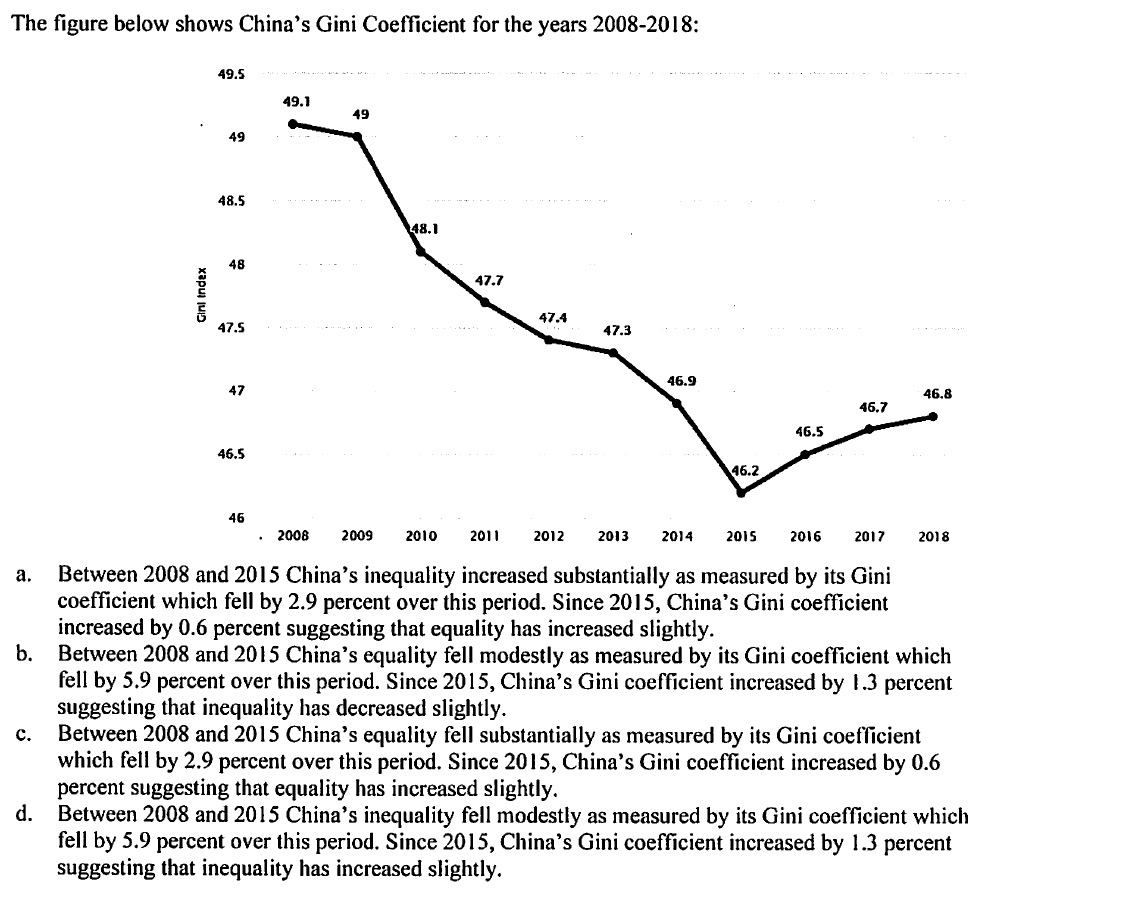
Which ofthe following statements is true regarding long-run growth in China? a. b. China grew very slowly between 1949 and 1978, but growth really took off after 1978 in the reform period which coincided with slower population growth and thus a decline in real GDP per capita. China grew rapidly between 1949 and 1978, but growth really took off alter 1978 in the reform period which coincided with a higher population growth and thus a higher increase in real GDP per capita. China grew rapidly between 1949 and 1978, but growth really took off after 1978 in the reform period which coincided with slower population growth and thus a higher increase in real GDP per capita. . China grew very slowly between 1949 and 1938, but growth really took ofTal'ter 1978 in the reform period which coincided with higher population growth and thus a decline in real GDP per capita. Consider the following diagram which shows the investment share of GDP in China between 1978 and 2016. Total Investment 45% 35% Gross fixed capital formation 30% Percent of GDP 25%% 20% 15%% 10% Inventory accumulation 0% 1978 a. Inventory accumulation was already around 20% of GDP at the end of the 1980s and stayed in that range through most of the 1980s. Starting in 1999, fixed investment increased significantly to 45% of GDP, where it remained through 2016.b. Inventory accumulation was already around 20% of GDP at the end of the 1980s and stayed in that range through most of the 1980s. Starting in 1999, fixed investment increased significantly to 45% of GDP, where it remained through 2016. C. Gross fixed capital formation was already around 30% of GDP at the end of the 1970s and stayed in that range through most of the 1980s. Starting in 2009, fixed investment increased significantly to 45% of GDP, where it remained through 2014. d. Gross fixed capital formation was already around 30% of GDP at the end of the 1970s and stayed in that range through most of the 1980s. Starting in 2009, fixed investment increased significantly to 45% of GDP, where it remained through 2014.Consider the figure below which shows the share of rural population in poverty: 50% 45% 40% 35% World Bank international poverty line: (Originally $1/day) 30% 25% Current 2016 Chinese official poverty line 20% Revised 2008 15% Chinese official povery line 10% Original 1985 Chinese offidal povery IIne 5% x 0% Which of the following statements is NOT true regarding the poverty figures above? a. The 2008 official Chinese poverty line is almost identical to the World Bank dollar-a-day standard.b. According to the 2008 Chinese official poverty line the number of rural people under the poverty line had declined by almost 90%. According to the most recent poverty line (2016), as of 2010, roughly 5% of the rural population in China are under the poverty line. d. The poverty rate among rural residents is substantially higher, between the late 1970s and early 1980s, if the World Bank's poverty line measure of $1/day is used.The figure below shows China's Gini Coefficient for the years 2008-2018: 19.5 49.1 49 49 48.5 . . . . . - . . 48.1 48 47.7 Girl tndex 47.4 17.5 47.3 16.9 47 46.8 16.7 46.5 46.5 16.2 46 2008 2009 2010 2011 2012 2013 2014 2015 2016 2017 2018 a. Between 2008 and 2015 China's inequality increased substantially as measured by its Gini coefficient which fell by 2.9 percent over this period. Since 2015, China's Gini coefficient increased by 0.6 percent suggesting that equality has increased slightly. b. Between 2008 and 2015 China's equality fell modestly as measured by its Gini coefficient which fell by 5.9 percent over this period. Since 2015, China's Gini coefficient increased by 1.3 percent suggesting that inequality has decreased slightly. C. Between 2008 and 2015 China's equality fell substantially as measured by its Gini coefficient which fell by 2.9 percent over this period. Since 2015, China's Gini coefficient increased by 0.6 percent suggesting that equality has increased slightly. d. Between 2008 and 2015 China's inequality fell modestly as measured by its Gini coefficient which fell by 5.9 percent over this period. Since 2015, China's Gini coefficient increased by 1.3 percent suggesting that inequality has increased slightly
Step by Step Solution
There are 3 Steps involved in it
Step: 1
Get Instant Access to Expert-Tailored Solutions
See step-by-step solutions with expert insights and AI powered tools for academic success
Step: 2
Step: 3
Ace Your Homework with AI
Get the answers you need in no time with our AI-driven, step-by-step assistance