Please answer all the questions with blanks, boxes, and graphs with coordinates please. 1. Characteristics of competitive markets The competitive market model depends on the
Please answer all the questions with blanks, boxes, and graphs with coordinates please.
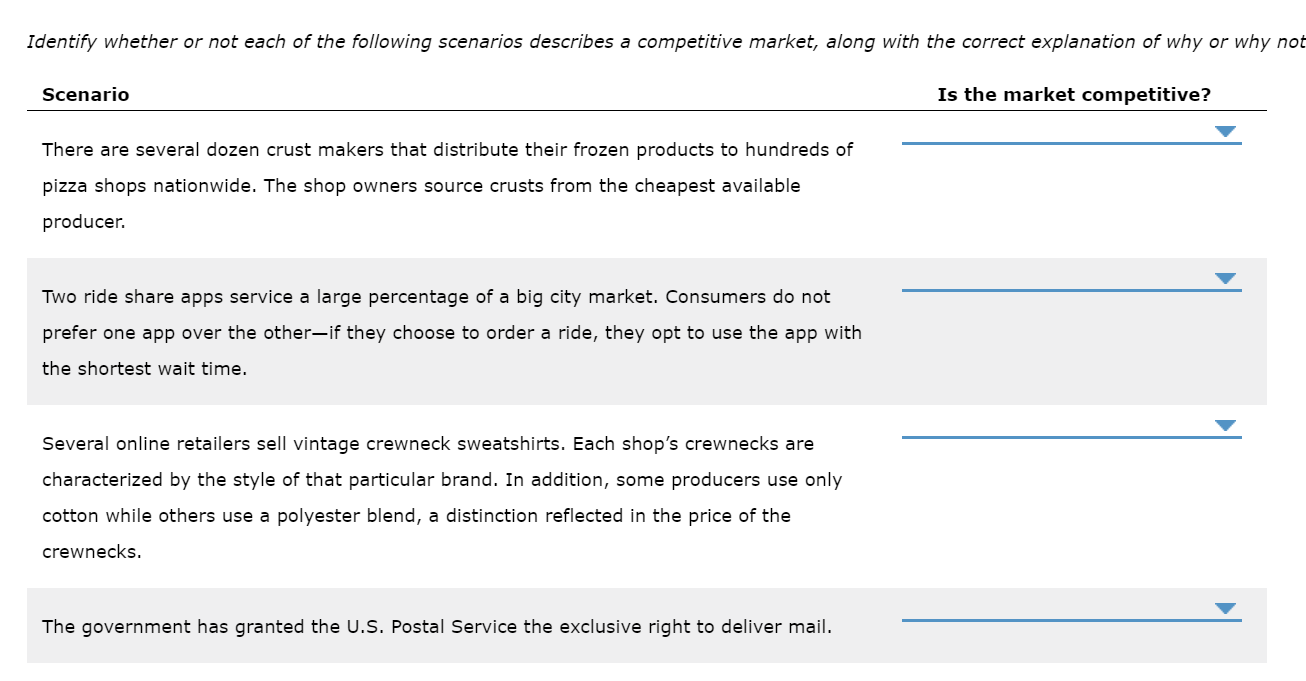
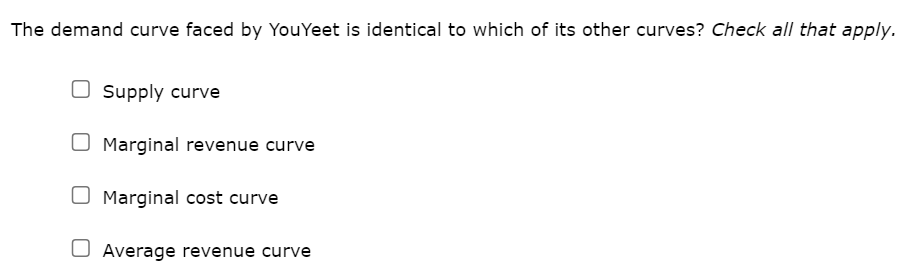
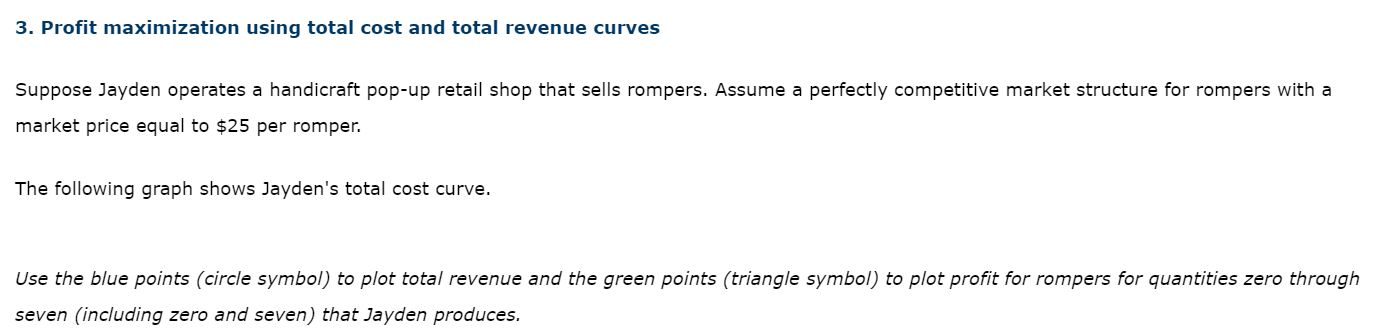
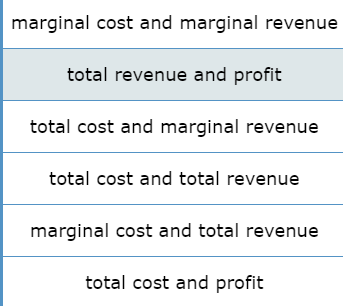
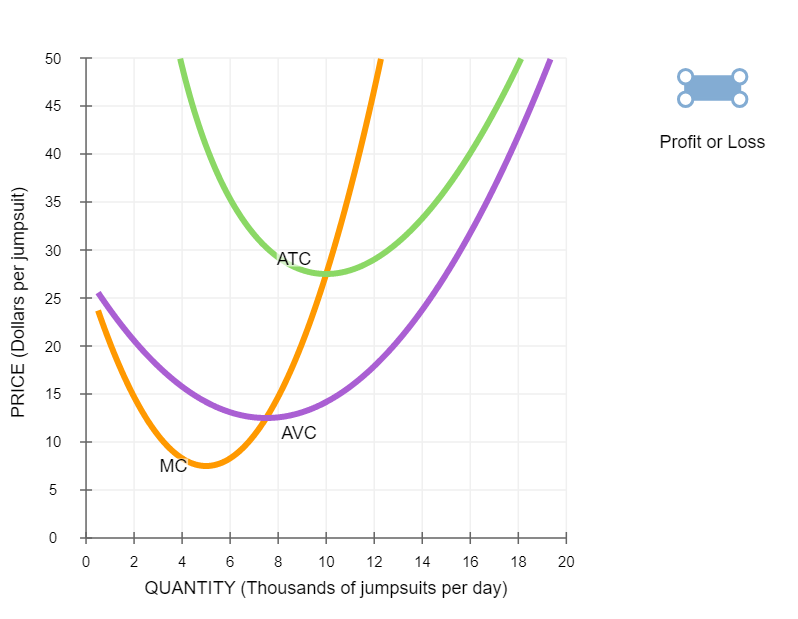
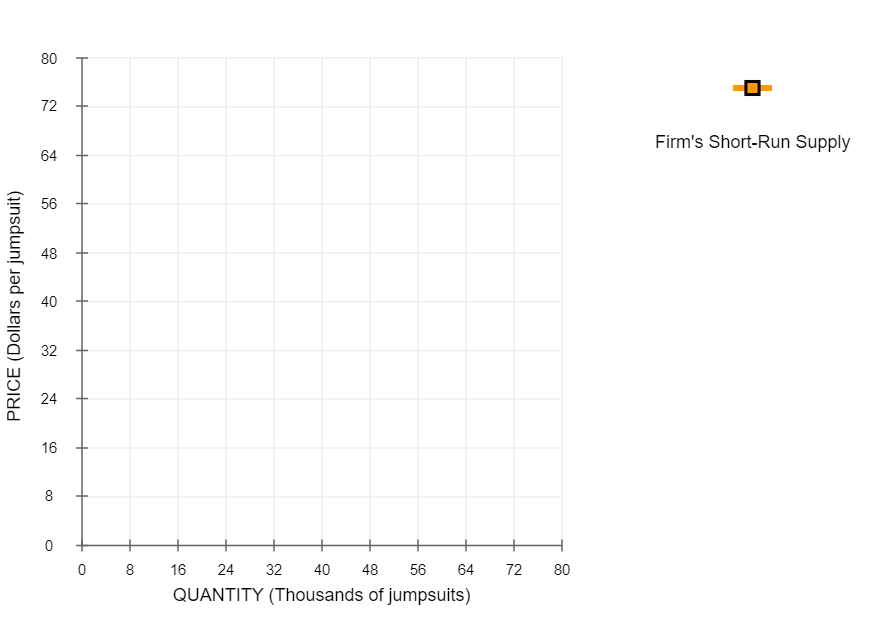
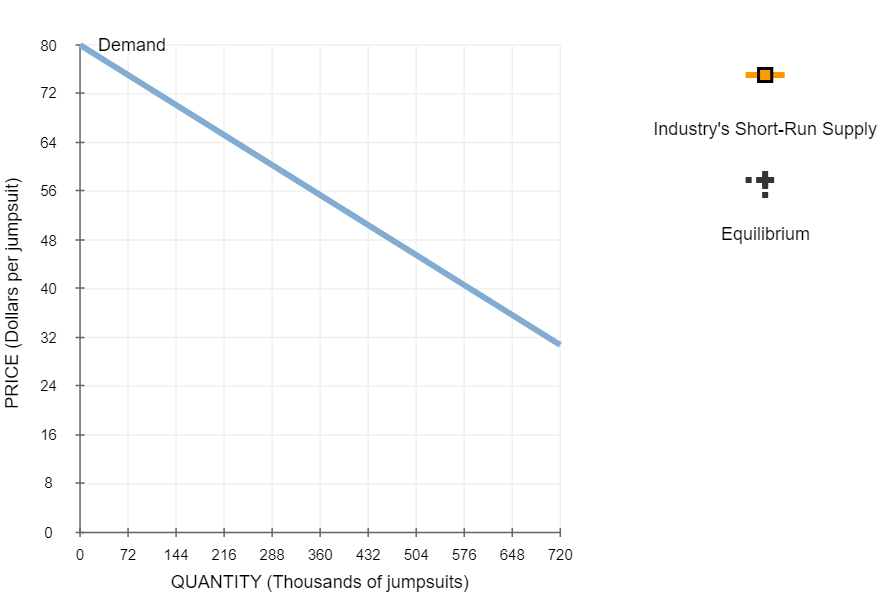
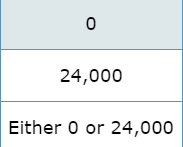
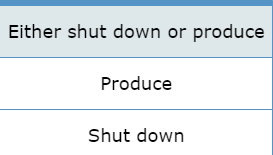
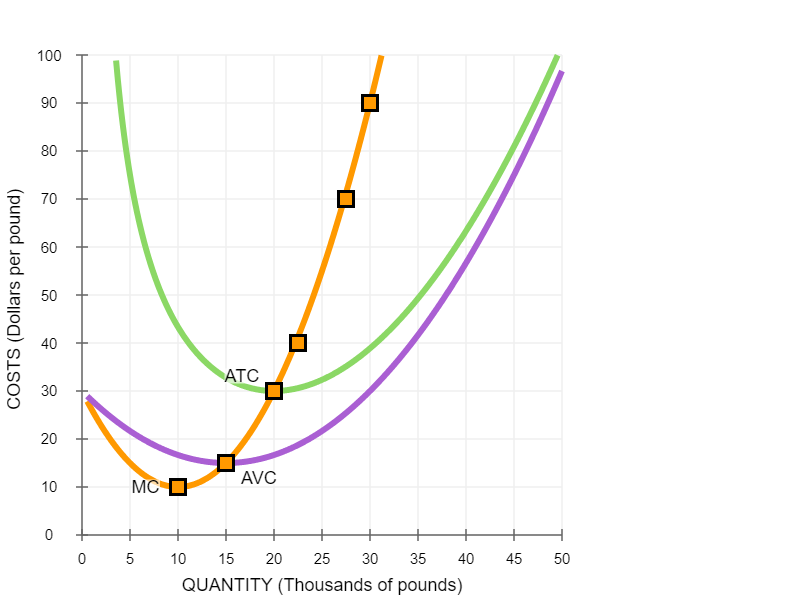
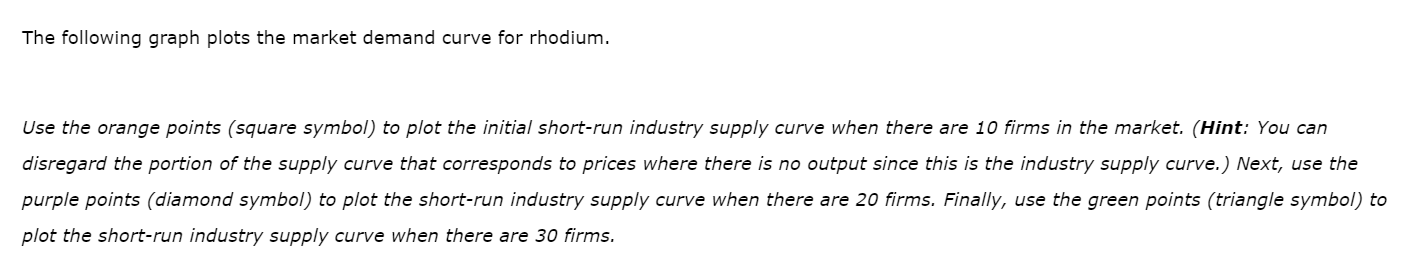
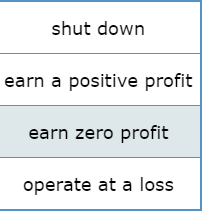
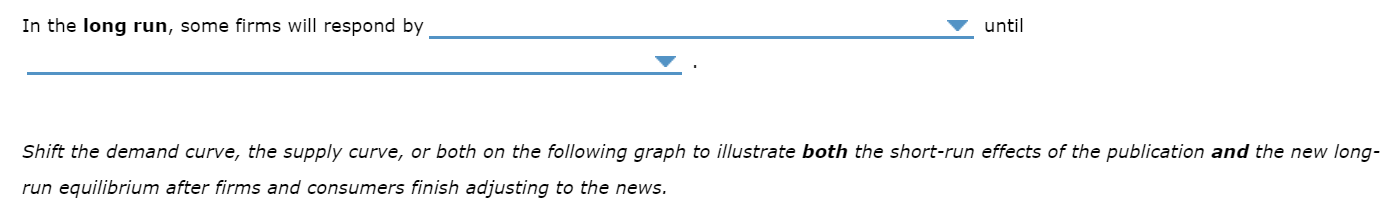
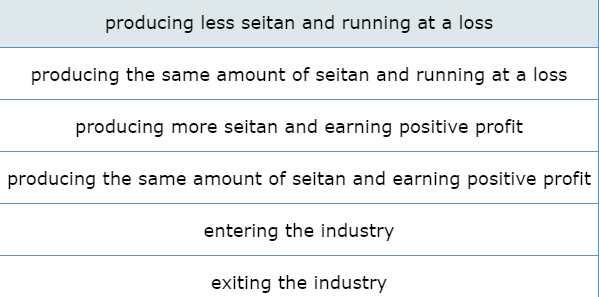
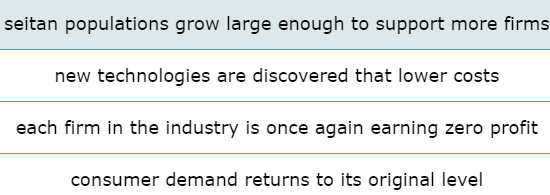
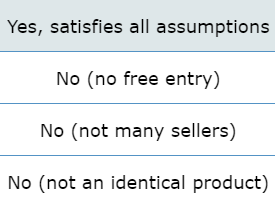
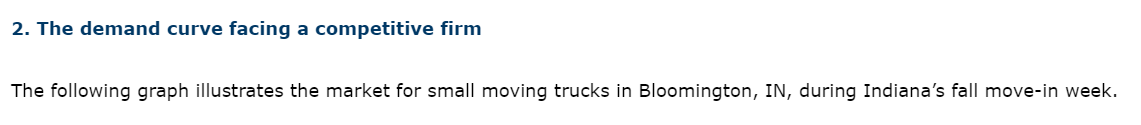
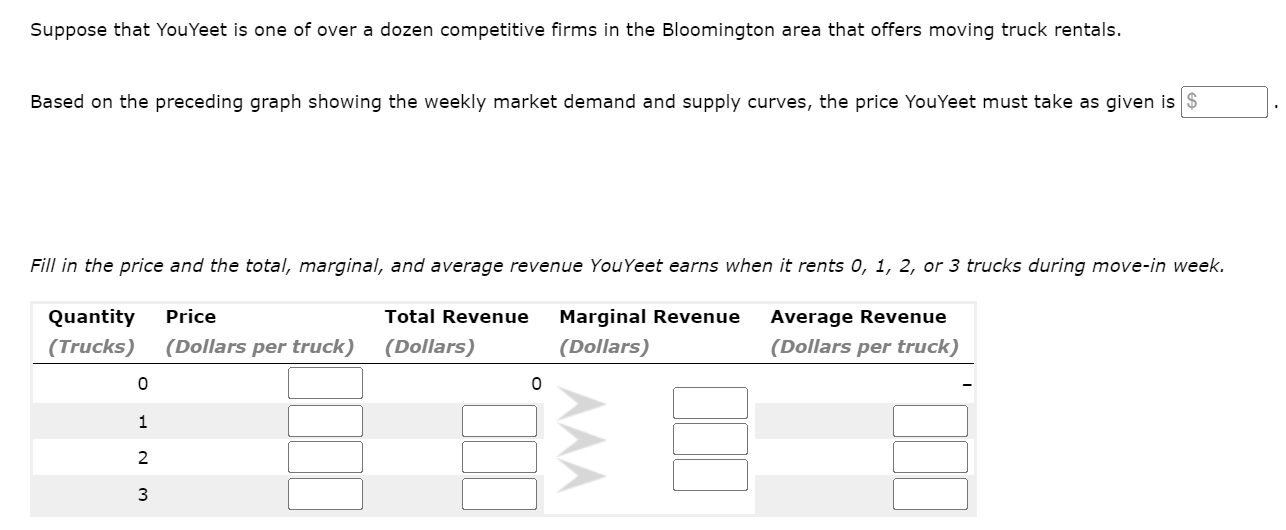
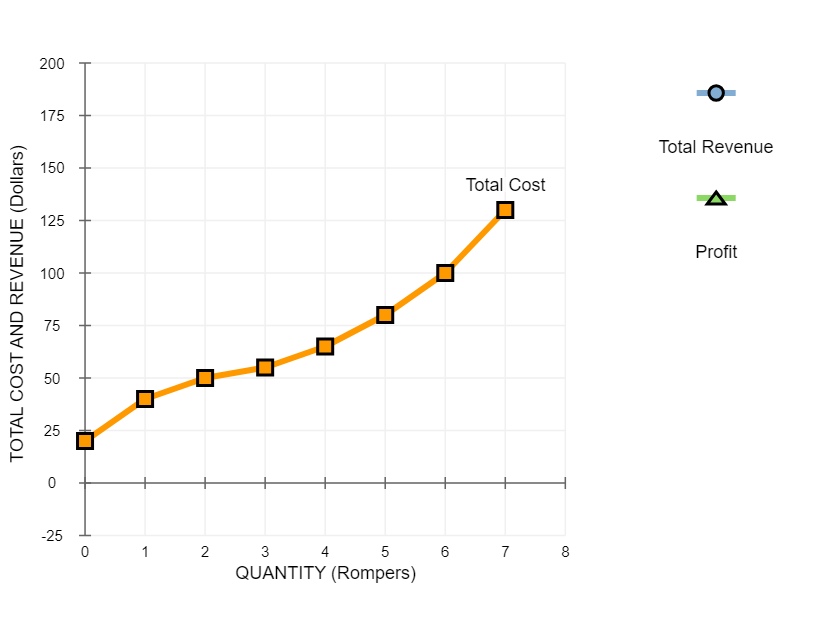
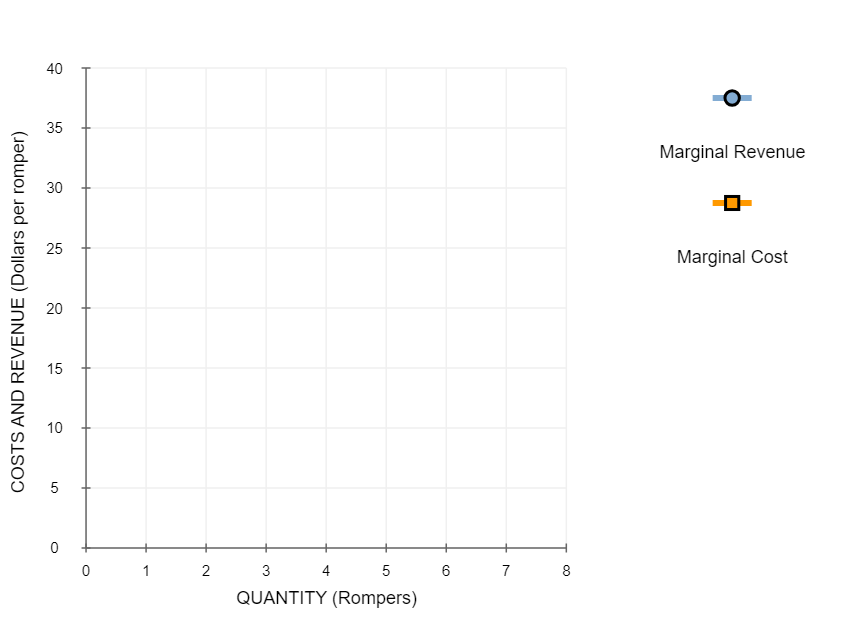
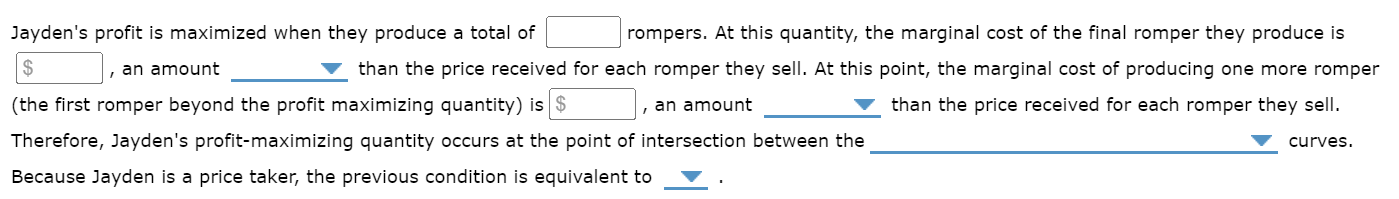
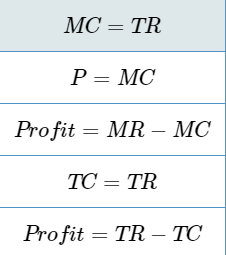
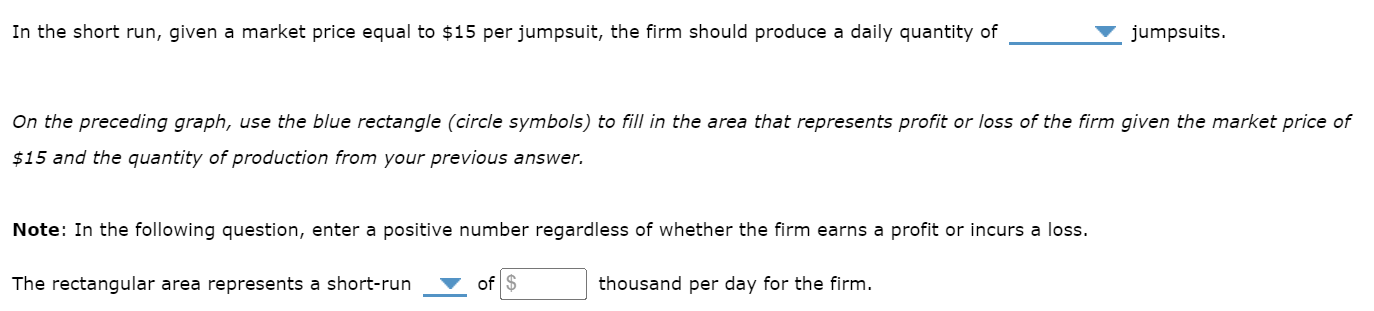
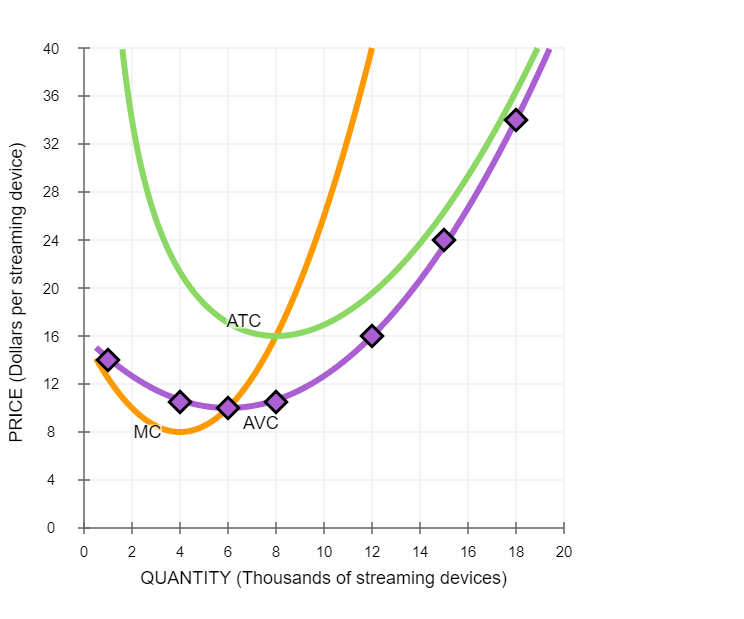
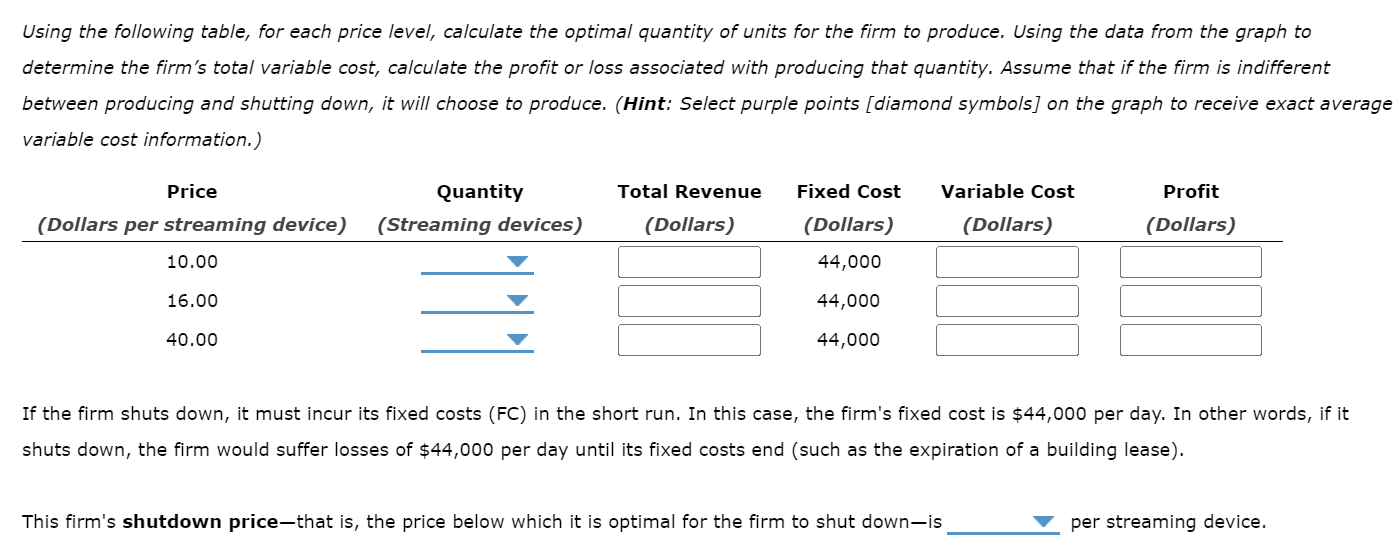
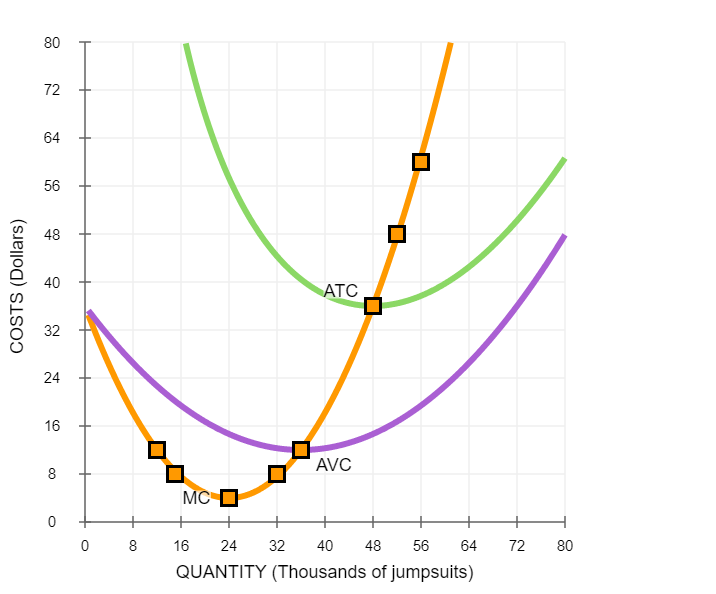
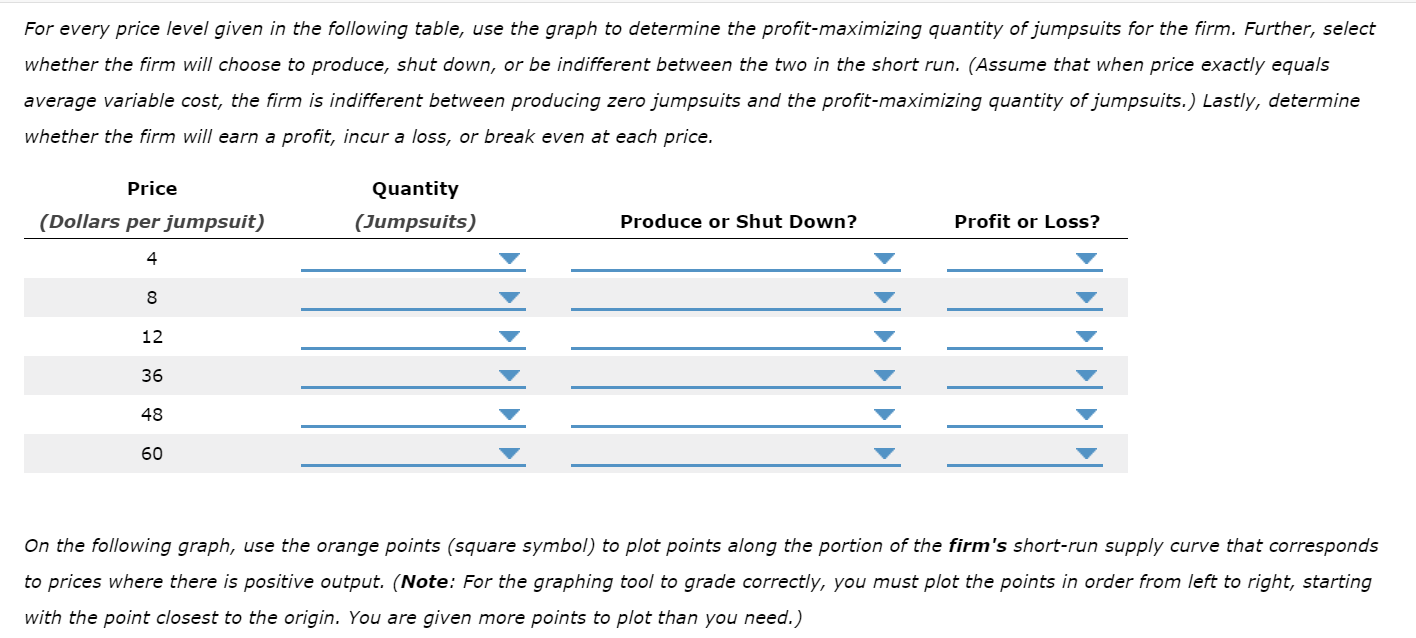
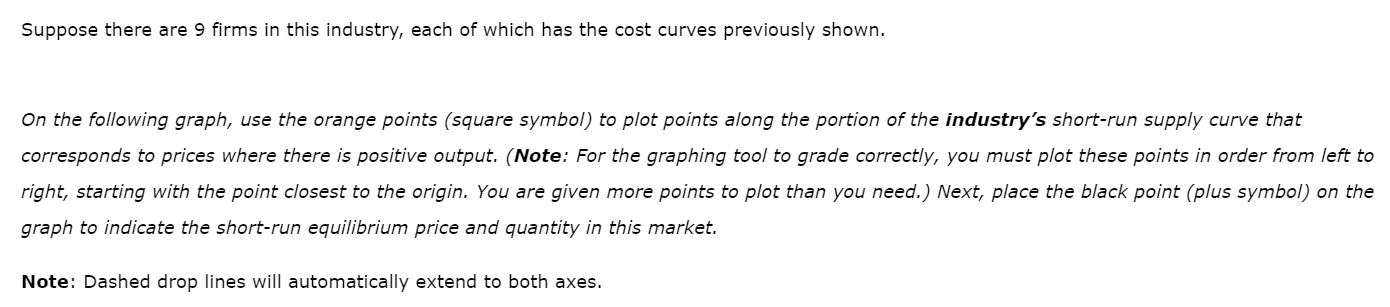
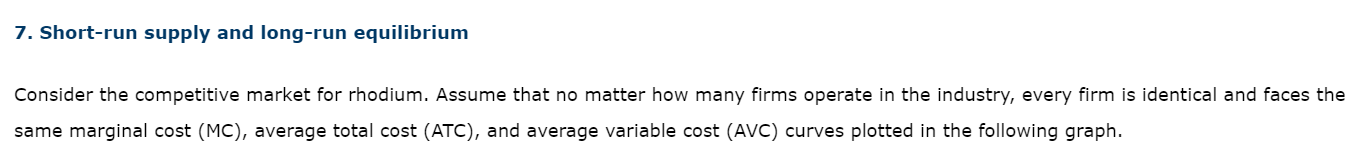
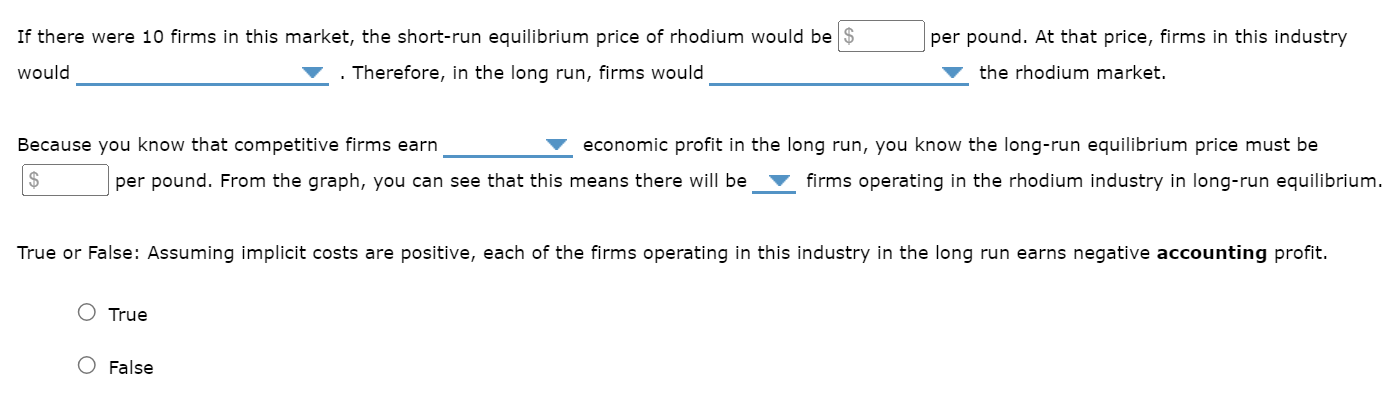
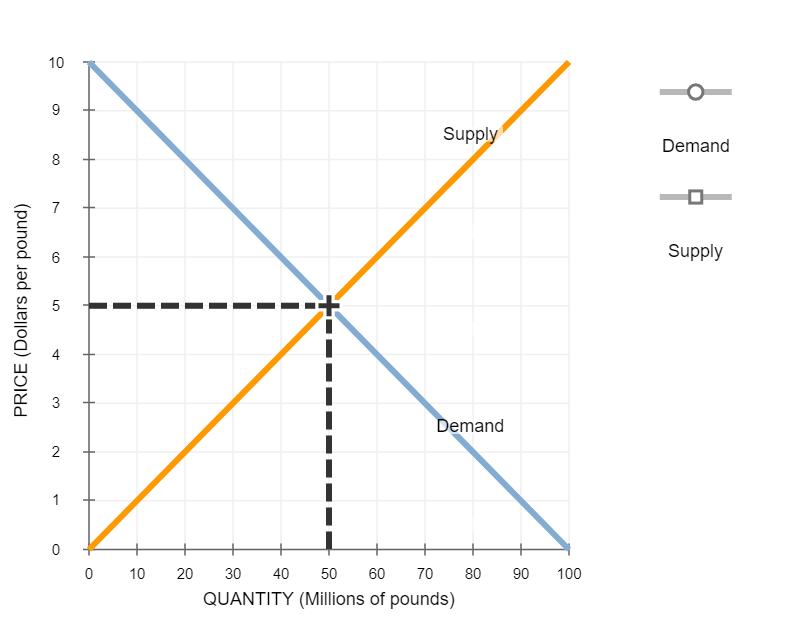
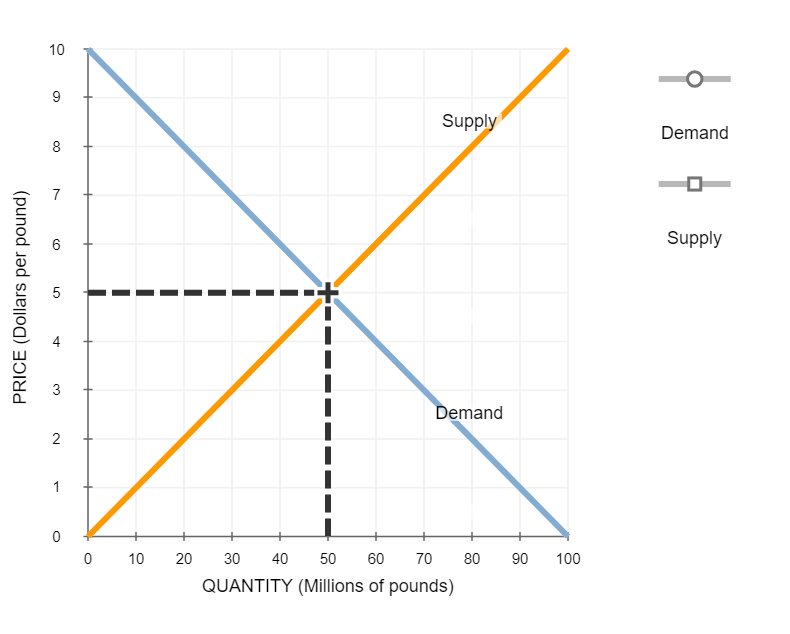
1. Characteristics of competitive markets The competitive market model depends on the following three core assumptions: 1. There must be many buyers and sellers-a few players can't dominate the market. 2. Firms must produce an identical product-buyers must regard all sellers' products as equivalent. 3. Firms and resources must be fully mobile, allowing free entry into and exit from the industry. The first two conditions imply that all consumers and firms are price takers. While the third is not necessary for price-taking behavior, assume for this problem that a market cannot maintain competition in the long run without free entry.Identify whether or not each of the following scenarios describes a competitive market, along with the correct explanation of why or why not Scenario Is the market competitive? There are several dozen crust makers that distribute their frozen products to hundreds of pizza shops nationwide. The shop owners source crusts from the cheapest available producer. Two ride share apps service a large percentage of a big city market. Consumers do not prefer one app over the other-if they choose to order a ride, they opt to use the app with the shortest wait time. Several online retailers sell vintage crewneck sweatshirts. Each shop's crewnecks are characterized by the style of that particular brand. In addition, some producers use only cotton while others use a polyester blend, a distinction reflected in the price of the crewnecks. The government has granted the U.S. Postal Service the exclusive right to deliver mail.Yes, satisfies all assumptions No (no free entry) No (not many sellers) No (not an identical product)2. The demand curve facing a competitive firm The following graph illustrates the market for small moving trucks in Bloomington, IN, during Indiana's fall move-in week.100 Demand 90 Supply 80 70 60 50 PRICE (Dollars per small truck) 40 30 20 10 0 0 1 2 3 4 5 6 7 8 9 10 QUANTITY (Hundreds of small trucks)Suppose that YouYeet is one of over a dozen competitive firms in the Bloomington area that offers moving truck rentals. Based on the preceding graph showing the weekly market demand and supply curves, the price YouYeet must take as given is $ Fill in the price and the total, marginal, and average revenue YouYeet earns when it rents 0, 1, 2, or 3 trucks during move-in week. Quantity Price Total Revenue Marginal Revenue Average Revenue (Trucks) (Dollars per truck) (Dollars) (Dollars) (Dollars per truck) 0 0 2 3The demand curve faced by YouYeet is identical to which of its other curves? Check all that apply. O Supply curve O Marginal revenue curve O Marginal cost curve O Average revenue curve3. Profit maximization using total cost and total revenue curves Suppose Jayden operates a handicraft pop-up retail shop that sells rompers. Assume a perfectly competitive market structure for rompers with a market price equal to $25 per romper. The following graph shows Jayden's total cost curve. Use the blue points (circle symbol) to plot total revenue and the green points (triangle symbol) to plot profit for rompers for quantities zero through seven (including zero and seven) that Jayden produces.200 O 175 Total Revenue 150 Total Cost A 125 Profit 100 TOTAL COST AND REVENUE (Dollars) 75 50 25 0 -25 0 1 2 3 4 5 6 7 8 QUANTITY (Rompers)40 O 35 Marginal Revenue 30 25 Marginal Cost COSTS AND REVENUE (Dollars per romper) 20 15 10 5 0 0 1 2 3 4 5 6 7 8 QUANTITY (Rompers)Jayden's profit is maximized when they produce a total of rompers. At this quantity, the marginal cost of the final romper they produce is $ , an amount than the price received for each romper they sell. At this point, the marginal cost of producing one more romper (the first romper beyond the profit maximizing quantity) is $ an amount than the price received for each romper they sell. Therefore, Jayden's profit-maximizing quantity occurs at the point of intersection between the curves. Because Jayden is a price taker, the previous condition is equivalent tomarginal cost and marginal revenue total revenue and profit total cost and marginal revenue total cost and total revenue marginal cost and total revenue total cost and profitMC = TR P = MC Profit = MR - MC TO= TR Profit = TR - TC4. Profit maximization in the cost-curve diagram The following graph plots daily cost curves for a firm operating in the competitive market for jumpsuits. Hint: Once you have positioned the rectangle on the graph, select a point to observe its coordinates.50 45 Profit or Loss 40 35 30 ATC 25 PRICE (Dollars per jumpsuit) 20 15 10 AVC MC 5 0 0 2 4 6 8 10 12 14 16 18 20 QUANTITY (Thousands of jumpsuits per day)In the short run, given a market price equal to $15 per jumpsuit, the firm should produce a daily quantity of V jumpsuits. On the preceding graph, use the blue rectangle (circle symbols) to fill in the area that represents profit or loss of the firm given the market price of $15 and the quantity of production from your previous answer. Note: In the following question, enter a positive number regardless of whether the firm earns a profit or incurs a loss. The rectangular area represents a short-run of $ thousand per day for the firm.2,000 7,500 8,000 10,0005. Profit maximization and shutting down in the short run The following graph plots daily cost curves for a firm operating in the competitive market for streaming devices.40 36 32 28 24 20 PRICE (Dollars per streaming device) ATC 16 12 8 MC AVC 4 0 2 4 6 8 10 12 14 16 18 20 QUANTITY (Thousands of streaming devices)Using the following table, for each price level, calculate the optimal quantity of units for the firm to produce. Using the data from the graph to determine the firm's total variable cost, calculate the profit or loss associated with producing that quantity. Assume that if the firm is indifferent between producing and shutting down, it will choose to produce. (Hint: Select purple points [diamond symbols] on the graph to receive exact average variable cost information.) Price Quantity Total Revenue Fixed Cost Variable Cost Profit (Dollars per streaming device) (Streaming devices) (Dollars) (Dollars) (Dollars) (Dollars) 10.00 44,000 16.00 44,000 40.00 44,000 If the firm shuts down, it must incur its fixed costs (FC) in the short run. In this case, the firm's fixed cost is $44,000 per day. In other words, if it shuts down, the firm would suffer losses of $44,000 per day until its fixed costs end (such as the expiration of a building lease). This firm's shutdown price-that is, the price below which it is optimal for the firm to shut down-is per streaming device.1,000 4 000 6,000 8,000 12,000 15,000 18,000$10.00 $16.00 $20.00 $40.006. Deriving the short-run supply curve The following graph plots the marginal cost (MC) curve, average total cost (ATC) curve, and average variable cost (AVC) curve for a firm operating in the competitive market for jumpsuits.80 72 64 56 48 0 COSTS (Dollars) 40 ATC 32 24 16 AVC 8 MC O 0 0 8 16 24 32 40 48 56 64 72 80 QUANTITY (Thousands of jumpsuits)For every price level given in the following table, use the graph to determine the profit-maximizing quantity of jumpsuits for the firm. Further, select whether the firm will choose to produce, shut down, or be indifferent between the two in the short run. (Assume that when price exactly equals average variable cost, the firm is indifferent between producing zero jumpsuits and the profit-maximizing quantity of jumpsuits.) Lastly, determine whether the firm will earn a profit, incur a loss, or break even at each price. Price Quantity (Dollars per jumpsuit) (Jumpsuits) Produce or Shut Down? Profit or Loss? 4 8 12 36 48 60 On the following graph, use the orange points (square symbol) to plot points along the portion of the firm's short-run supply curve that corresponds to prices where there is positive output. (Note: For the graphing tool to grade correctly, you must plot the points in order from left to right, starting with the point closest to the origin. You are given more points to plot than you need.)80 72 Firm's Short-Run Supply 64 56 48 40 PRICE (Dollars per jumpsuit) 32 24 16 8 0 0 8 16 24 32 40 48 56 64 72 80 QUANTITY (Thousands of jumpsuits)Suppose there are 9 firms in this industry, each of which has the cost curves previously shown. On the following graph, use the orange points (square symbol) to plot points along the portion of the industry's short-run supply curve that corresponds to prices where there is positive output. (Note: For the graphing tool to grade correctly, you must plot these points in order from left to right, starting with the point closest to the origin. You are given more points to plot than you need. ) Next, place the black point (plus symbol) on the graph to indicate the short-run equilibrium price and quantity in this market. Note: Dashed drop lines will automatically extend to both axes.80 Demand 72 Industry's Short-Run Supply 64 56 Equilibrium 48 40 PRICE (Dollars per jumpsuit) 32 24 16 8 0 72 144 216 288 360 432 504 576 648 720 QUANTITY (Thousands of jumpsuits)At the current short-run market price, firms will in the short run. In the long run,24,000 Either 0 or 24,000Either shut down or produce Produce Shut downBreak even Loss Profitfirms will neither enter nor exit some firms will enter some firms will exit7. Short-run supply and long-run equilibrium Consider the competitive market for rhodium. Assume that no matter how many firms operate in the industry, every firm is identical and faces the same marginal cost (MC), average total cost (ATC), and average variable cost (AVC) curves plotted in the following graph.100 90 80 70 60 COSTS (Dollars per pound) 50 40 ATC 30 20 10 MC O AVC 0 0 5 10 15 20 25 30 35 40 45 50 QUANTITY (Thousands of pounds)The following graph plots the market demand curve for rhodium. Use the orange points (square symbol) to plot the initial short-run industry supply curve when there are 10 firms in the market. (Hint: You can disregard the portion of the supply curve that corresponds to prices where there is no output since this is the industry supply curve. ) Next, use the purple points (diamond symbol) to plot the short-run industry supply curve when there are 20 firms. Finally, use the green points (triangle symbol) to plot the short-run industry supply curve when there are 30 firms.100 -0 90 Supply (10 firms) 80 70 60 Supply (20 firms) 50 A PRICE (Dollars per pound) 40 Supply (30 firms) Demand 30 20 10 0 0 125 250 375 500 625 750 875 1000 1125 1250 QUANTITY (Thousands of pounds)If there were 10 firms in this market, the short-run equilibrium price of rhodium would be $ per pound. At that price, firms in this industry would . Therefore, in the long run, firms would the rhodium market. Because you know that competitive firms earn economic profit in the long run, you know the long-run equilibrium price must be $ per pound. From the graph, you can see that this means there will be firms operating in the rhodium industry in long-run equilibrium. True or False: Assuming implicit costs are positive, each of the firms operating in this industry in the long run earns negative accounting profit. O True O Falseshut down earn a positive profit earn zero profit operate at a lossenter exit neither enter nor exitnegative zero positive10 20 308. Short-run and long-run effects of a shift in demand Suppose that the seitan industry is initially operating in long-run equilibrium at a price level of $5 per pound of seitan and quantity of 50 million pounds per year. Suppose a top medical journal publishes research that animal-alternative protein sources such as seitan could increase your expected lifespan by 5 years. The publication is expected to cause consumers to demand seitan at every price. In the short run, firms will respond by Shift the demand curve, the supply curve, or both on the following graph to illustrate these short-run effects of the publication.10 9 O Supply 8 Demand 7 O 6 Supply 5 PRICE (Dollars per pound) 4 3 Demand 2 0 0 10 20 30 40 50 60 70 80 90 100 QUANTITY (Millions of pounds)In the long run, some firms will respond by until Shift the demand curve, the supply curve, or both on the following graph to illustrate both the short-run effects of the publication and the new long- run equilibrium after firms and consumers finish adjusting to the news.10 9 O Supply 8 Demand 7 6 Supply 5 PRICE (Dollars per pound) 4 3 Demand 2 0 0 10 20 30 40 50 60 70 80 90 100 QUANTITY (Millions of pounds)The new equilibrium price and quantity suggest that the shape of the long-run supply curve in this industry is V in the long run.producing less seitan and running at a loss producing the same amount of seitan and running at a loss producing more seitan and earning positive profit producing the same amount of seitan and earning positive profit entering the industry exiting the industryproducing more seitan and running at a loss producing more seitan and earning positive profit producing less seitan and running at a loss producing less seitan and earning positive profit exiting the industry entering the industryseitan populations grow large enough to support more firms new technologies are discovered that lower costs each firm in the industry is once again earning zero profit consumer demand returns to its original levelvertical upward sloping horizontal downward sloping
Step by Step Solution
There are 3 Steps involved in it
Step: 1
Get Instant Access to Expert-Tailored Solutions
See step-by-step solutions with expert insights and AI powered tools for academic success
Step: 2
Step: 3
Ace Your Homework with AI
Get the answers you need in no time with our AI-driven, step-by-step assistance