

Answered step by step
Verified Expert Solution
Question
1 Approved Answer
Please answer and explain :) The graph of y = f(x) is transformed into the graph of g(x) - 2 = f((-3)(x + 1)). The
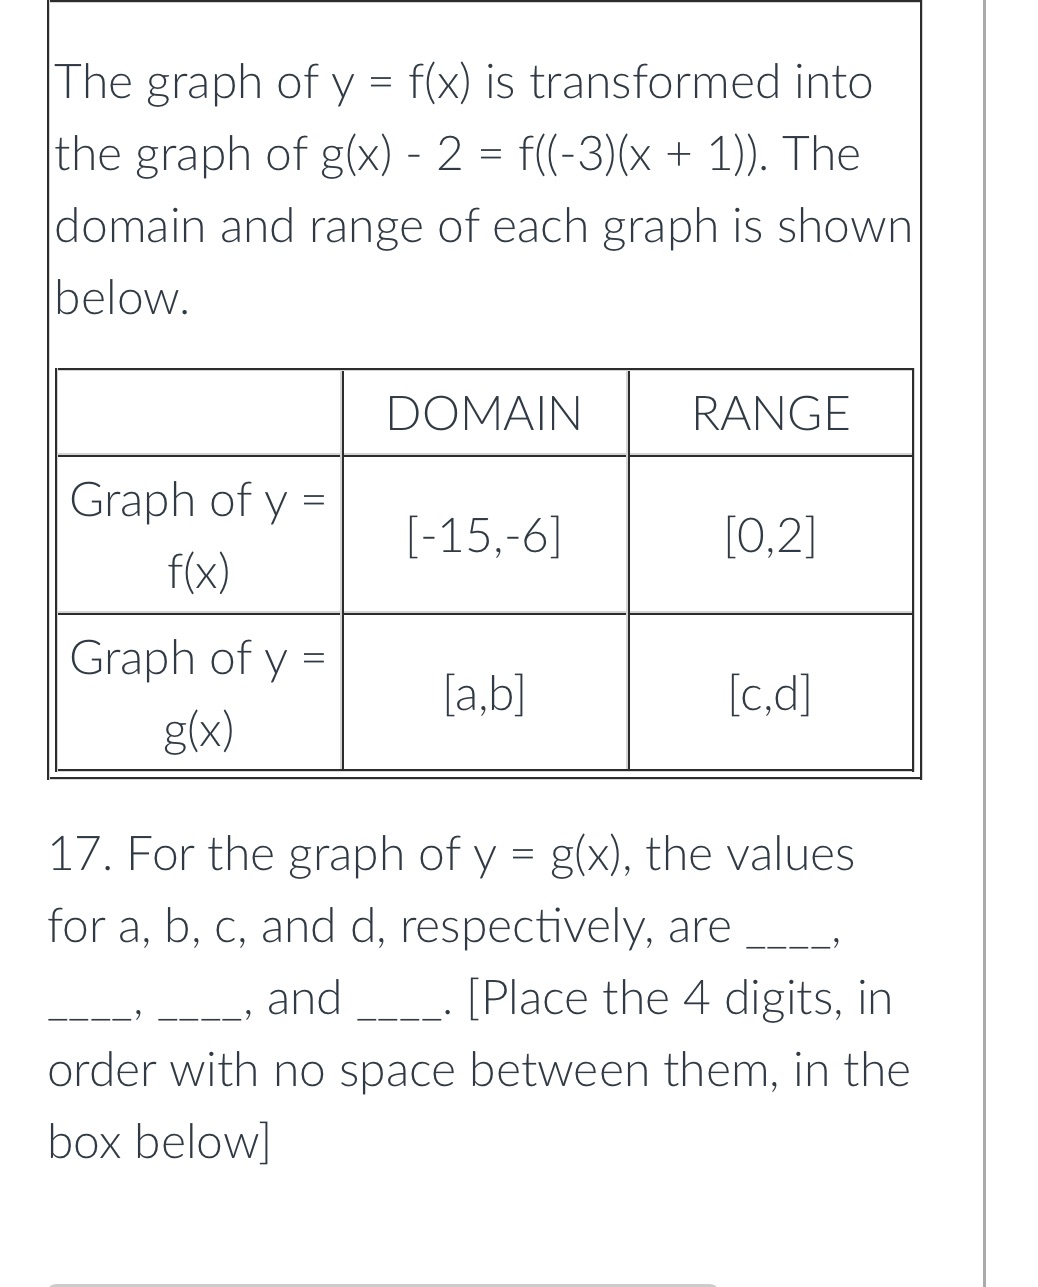
Please answer and explain :)

Step by Step Solution
There are 3 Steps involved in it
Step: 1

Get Instant Access to Expert-Tailored Solutions
See step-by-step solutions with expert insights and AI powered tools for academic success
Step: 2

Step: 3
Ace Your Homework with AI
Get the answers you need in no time with our AI-driven, step-by-step assistance
Get Started
Discovering Advanced Algebra An Investigative Approach
Authors: Jerald Murdock, Ellen Kamischke, Eric Kamischke
1st edition
1559539844, 978-1604400069, 1604400064, 978-1559539845