Answered step by step
Verified Expert Solution
Question
1 Approved Answer
PLEASE ANSWER AND TRY TO ATTACH AND SHOW ALL WORK. ATTACH FILES IF POSSIBLE. ANSWER ALL! In this exercise we will work with a portfolio
PLEASE ANSWER AND TRY TO ATTACH AND SHOW ALL WORK. ATTACH FILES IF POSSIBLE. ANSWER ALL!
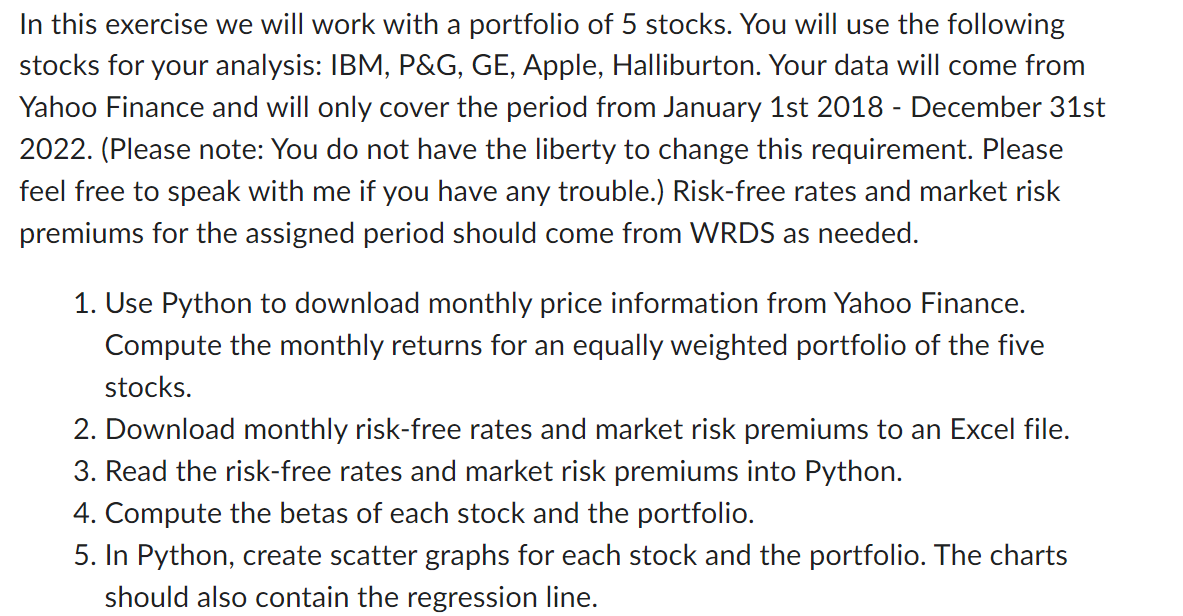
In this exercise we will work with a portfolio of 5 stocks. You will use the following stocks for your analysis: IBM, P\&G, GE, Apple, Halliburton. Your data will come from Yahoo Finance and will only cover the period from January 1st 2018 - December 31st 2022. (Please note: You do not have the liberty to change this requirement. Please feel free to speak with me if you have any trouble.) Risk-free rates and market risk premiums for the assigned period should come from WRDS as needed. 1. Use Python to download monthly price information from Yahoo Finance. Compute the monthly returns for an equally weighted portfolio of the five stocks. 2. Download monthly risk-free rates and market risk premiums to an Excel file. 3. Read the risk-free rates and market risk premiums into Python. 4. Compute the betas of each stock and the portfolio. 5. In Python, create scatter graphs for each stock and the portfolio. The charts should also contain the regression lineStep by Step Solution
There are 3 Steps involved in it
Step: 1
Get Instant Access to Expert-Tailored Solutions
See step-by-step solutions with expert insights and AI powered tools for academic success
Step: 2
Step: 3
Ace Your Homework with AI
Get the answers you need in no time with our AI-driven, step-by-step assistance
Get Started