

Answered step by step
Verified Expert Solution
Question
1 Approved Answer
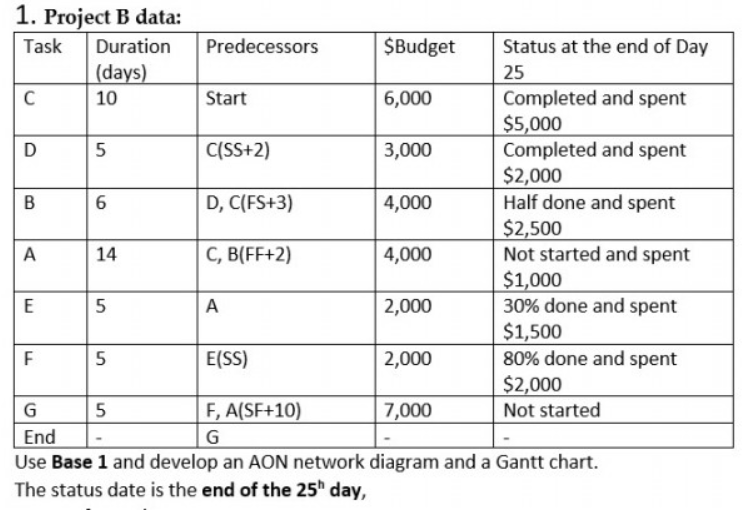
Please answer as soon as possible 1. Project B data: Task Duration Predecessors $Budget Status at the end of Day (days) 25 C 10 Start
Please answer as soon as possible
Step by Step Solution
There are 3 Steps involved in it
Step: 1

Get Instant Access to Expert-Tailored Solutions
See step-by-step solutions with expert insights and AI powered tools for academic success
Step: 2

Step: 3
Ace Your Homework with AI
Get the answers you need in no time with our AI-driven, step-by-step assistance
Get Started
Transport Operations
Authors: Allen Stuart
2nd Edition
978-0470115398, 0470115394