Question: Please Answer Asap Thank you! A30. SUPPLEMENT A SPREADSHEET MODELING: AN INTRODUCTION Problems 1. Kaizer Plastic produces a variety of plastic items for pack Soek
Please Answer Asap Thank you!
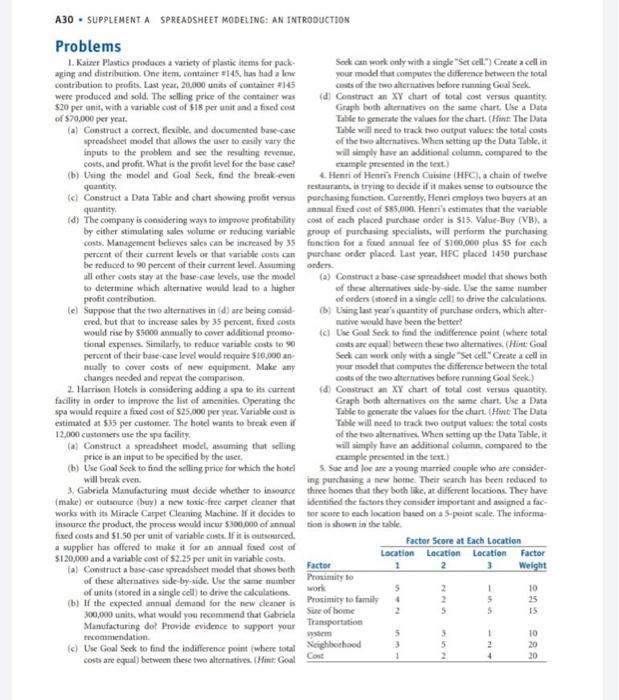
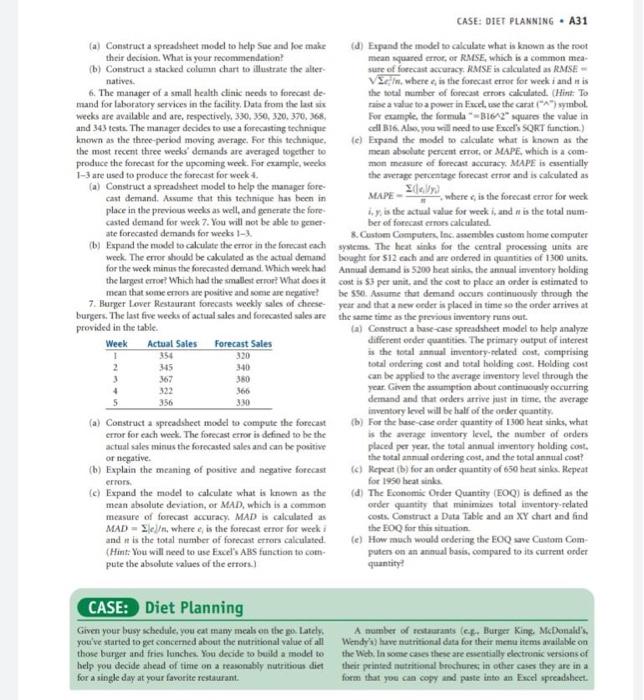
A30. SUPPLEMENT A SPREADSHEET MODELING: AN INTRODUCTION Problems 1. Kaizer Plastic produces a variety of plastic items for pack Soek can work only with a single "Set cell. Create a celin aying and distribution. One item, container 145, has had a low your model that compute the difference between the total contribution to profits. Last year, 20.000 units of container #145 costs of the two alternatives before running Goal Seck were produced and sold. The selling price of the container was (d) Construct an XY chart of total cost versus quantity $20 per unit, with a variable cost of 518 per unit and a fixed cout Graph both alternatives on the same chart. Use a Data of $70.000 per year. Table to generate the values for the chart. (Hint: The Data (a) Construct a correct, flexible and documented buse-case Table will need to track the output values the total costs spreadsheet model that allows the wier to easily vary the of the two alternatives. When setting up the Duta Table, it inputs to the problem and see the resulting revenue. will simply have an additional column, compared to the costs, and profit. What is the profit level for the base came? example presented in the text.) (b) Using the model and Goal Seck, find the break-even Hent of Henris French Cuisine (HFC), a chain of twelve quantity restaurants, is trying to decide if it makes sense to absource the (c) Construct a Data Table and chart showing profit vervus purchasing function. Currently, Henri employs two buyers at an quantity annual fixed cost of $85.00. Henri's estimates that the variable (d) The company is considering ways to improve profitability cost of each placed purchase order is 515. Value-Buy (VB), a by either stimulating sales volume or reducing variable group of purchasing specialists, will perform the purchasing costs. Management believes sales can be increased by 35 fonction for a fred annual fee of $100,000 plus ss for each percent of their current levels or that variable costs can purchase order placed. Last year, HEC placed 1450 purchase be reduced to 90 percent of their current ind. Aaming onder all other costs stay at the base-case levels, use the model (a) Construct a buse-case spreadsheet model that shows both to determine which alternative world lead to a higher of these alternatives side-by-side. Use the same number profit contribution of orders stored in a single cell) to drive the calculations le Suppose that the two alternatives in (d) are being consid- (5) Using last year's quantity of purchase orders, which alter ered, but that to increase sales by 35 percent, fixed costs native would have been the better! would rise by 55000 annually to cover additional promo di Use Goal Seck to find the indifference point where total tional expenses Similarly, to reduce variable costs to 90 costs are equal between these two alternatives (Him Goal percent of their basecame level would require 510,000 an Seck can work only with a single "Set cell. Create a cell in mually to cover costs of new equipment. Make any your model that compute the difference between the total changes needed and repeat the comparison, costs of the two alternatives before running Goal Seek.) 2. Harrison Hotels is considering adding a spa to its current (d) Construct an XY chart of total cost versus quantity facility in order to improve the list of amenities Operating the Graphs both alternatives on the same chart. Use a Data spa would require a fixed cost of $25,000 per year. Variable cost is Table to generate the values for the churt. (Hint: The Data estimated at $35 per customer. The hotel wants to break even if Table will need to track two output values the total costs 12,000 customers use the spa facility of the two alternatives. When setting up the Data Table, it (al Construct a spreadsheet model assuming that selling will simply have an additional column, compared to the price is an input to be specified by the uset. cuample presented in the text) (b) Use Goal Seek to find the selling price for which the hotel 5. Soe and Joe are a young married couple who are consider- will break even ing purchasing a new home. Their search has been reduced to 3. Gabriela Manufacturing must decide whether to insure three homes that they both like, at different location. They have (make) or cutoute buy) a new tosic free carpet deater that identified the factors they consider important and assigned a fac works with its Miracle Carpet Cleaning Machine. If it decides to for sure to cach location based on a 5-point scale. The informa insource the product, the process would incur 5300.000 of annual tion is shown in the table fixed costs and $150 per unit of variable costs. If it is outsourced. a supplier has offered to make it for an annual fixed cost of Factor Score at Each Location $120,000 and a variable cost of $2.25 per unit in variable costs. Location Location Location Factor al Construct a base-case spreadsheet model that shows both Factor 2 Weight of these alternatives side-by-side. Use the same number Proximity to of units (stored in a single cell) to drive the calculations work 1 10 (b) If the expected annual demand for the new deaner is Proximity to family 4 2 5 25 2 5 5 15 300,000 units, what would you recommend that Gabriela Sue of home Manufacturing dol Provide evidence to support your Transportation recommendation wiem 5 3 1 10 c) Use Goal Seck to find the indifference point where total Neighborhood 2 20 Cost 1 costs are equal) between these two alternatives. (Hint: Goal 2 4 20 natives CASE: DIET PLANNING A31 (a) Construct a spreadsheet model to help Sue and Joe make (d) Expand the model to calculate what is known as the root their decision. What is your recommendation! mean squared error or RMSE, which is a common mea (b) Construct a stacked column chart to illustrate the alter sure of forecast accuracy, RMSE is calculated as RMSE VEI, where is the forecast error for week i and his 6. The manager of a small health clinic needs to forecast de the total number of forecast crroes calculated. (Hint: To mand for laboratory services in the facility. Data from the last six ca value to a power in Excel use the carat ("Asymbol weeks are available and are respectively. 330, 350, 320, 370, 365, For example, the formula -B162"quire the value in and 343 tests. The manager decides to use a forecasting technique cell B16. Alus, you will need to use Excel's SORT function) known as the three-period moving average. For this technique e) Expand the model to calculate what is known as the the most recent three weeks' demands are averaged together to mean absolute percent error or MAPE, which is a com produce the forecast for the upcoming week. For example, wees mon measure of forecast accuracy, MAPE is essentially 1-3 are used to produce the forecast for weckt. the average percentage forecast error and is calculated as (a) Construct a spreadsheet model to help the manager for Slevy cast demand. Assume that this technique has been in MAPE where is the forecast error for week place in the previous weeks as well, and generate the fore isy, is the actual value for week and is the total num casted demand for week 7. You will not be able to gener ber of forecast crea calculated. ate forecasted demand for weeks 8. Custom Computers, Inc. assembles custom home computer (bExpand the modd to calculate the error in the forecast each systems. The heat sinks for the central processing units are weck. The error should be calculated as the actual demand bought for 512 cach and are ordered in quantities of 1300 units. for the week mins the forecasted demand. Which week had Annual demand is 5200 heat sinks the annual inventory holding the largest error? Which had the smallest errort What does it cost is $3 per unit, and the cost to place an order is estimated to mean that some enters are positive and some are negative? be s80. Assume that demand occurs continuously through the 7. Burger Lover Restaurant forecasts weekly sales of these year and that a new order is placed in time to the order arrives at burgers. The last five weeks of actual sales and forecasted sales are the same time as the previous inventory runs out. provided in the table. (a) Construct a base-case spreadsheet model to help analyze Week Actual Sales Forecast Sales different des quantities. The primary output of interest 1 354 320 is the total anulimientory-related cost comprising 2 315 3:40 total ordering cost and total holding cost. Holding cont 3 367 380 can be applied to the average inventory level through the 4 322 366 year. Given the assumption about continuously occurring 356 demand and that orders arrive just in time, the average inventory levd will be half of the order quantity (a) Construct a sprcadsheet model to compute the forecast (b) For the base-case order quantity of 1500 heat sinks, what crror for cach week. The forecast error is defined to be the is the average inventory level, the number of orders actual sales minus the forecasted sales and can be positive placed per year, the total annual inventory holding cost. or negative. the total anual ordering cost, and the total annual cost? (b) Explain the meaning of positive and negative forecast (c) Repeat (b) for an order quantity of 650 heat sinks. Repeat error for 1950 heat sinks (c) Expand the model to calculate what is known as the (d) The Economic Order Quantity EOQ) is defined as the mean absolute deviation, or MAD, which is a common order quantity that minimizes total inventory-related measure of forecast accuracy, MAD is calculated as costs. Construct a Data Table and an XY chart and find MAD-Sle, where is the forecast error for week the EOQ for this situation and it is the total number of forecast errors calculated. (e) How much would ordering the EOQ save Custom Com (Hint: You will need to use Excel's ABS function to com puterns on an annual basis, compared to its current ordet pute the absolute values of the errors) quantity? 390 CASE: Diet Planning Given your busy schedule, you cat many meals on the go. Lately you've started to get concerned about the nutritional value of all those burger and fries lunche. You decide to build a model to help you decide ahead of time on a reasonably nutritious diet for a single day at your favorite restaurant. A number of restaurants (c-. Burger King. McDonald's, Wendy's) have nutritional data for their menu items mailable on the Web In some cases these are essentially electronic versions of their printed nutritional brochures in other cases they are in a form that you can copy and paste into an Excel spreadsheet A30. SUPPLEMENT A SPREADSHEET MODELING: AN INTRODUCTION Problems 1. Kaizer Plastic produces a variety of plastic items for pack Soek can work only with a single "Set cell. Create a celin aying and distribution. One item, container 145, has had a low your model that compute the difference between the total contribution to profits. Last year, 20.000 units of container #145 costs of the two alternatives before running Goal Seck were produced and sold. The selling price of the container was (d) Construct an XY chart of total cost versus quantity $20 per unit, with a variable cost of 518 per unit and a fixed cout Graph both alternatives on the same chart. Use a Data of $70.000 per year. Table to generate the values for the chart. (Hint: The Data (a) Construct a correct, flexible and documented buse-case Table will need to track the output values the total costs spreadsheet model that allows the wier to easily vary the of the two alternatives. When setting up the Duta Table, it inputs to the problem and see the resulting revenue. will simply have an additional column, compared to the costs, and profit. What is the profit level for the base came? example presented in the text.) (b) Using the model and Goal Seck, find the break-even Hent of Henris French Cuisine (HFC), a chain of twelve quantity restaurants, is trying to decide if it makes sense to absource the (c) Construct a Data Table and chart showing profit vervus purchasing function. Currently, Henri employs two buyers at an quantity annual fixed cost of $85.00. Henri's estimates that the variable (d) The company is considering ways to improve profitability cost of each placed purchase order is 515. Value-Buy (VB), a by either stimulating sales volume or reducing variable group of purchasing specialists, will perform the purchasing costs. Management believes sales can be increased by 35 fonction for a fred annual fee of $100,000 plus ss for each percent of their current levels or that variable costs can purchase order placed. Last year, HEC placed 1450 purchase be reduced to 90 percent of their current ind. Aaming onder all other costs stay at the base-case levels, use the model (a) Construct a buse-case spreadsheet model that shows both to determine which alternative world lead to a higher of these alternatives side-by-side. Use the same number profit contribution of orders stored in a single cell) to drive the calculations le Suppose that the two alternatives in (d) are being consid- (5) Using last year's quantity of purchase orders, which alter ered, but that to increase sales by 35 percent, fixed costs native would have been the better! would rise by 55000 annually to cover additional promo di Use Goal Seck to find the indifference point where total tional expenses Similarly, to reduce variable costs to 90 costs are equal between these two alternatives (Him Goal percent of their basecame level would require 510,000 an Seck can work only with a single "Set cell. Create a cell in mually to cover costs of new equipment. Make any your model that compute the difference between the total changes needed and repeat the comparison, costs of the two alternatives before running Goal Seek.) 2. Harrison Hotels is considering adding a spa to its current (d) Construct an XY chart of total cost versus quantity facility in order to improve the list of amenities Operating the Graphs both alternatives on the same chart. Use a Data spa would require a fixed cost of $25,000 per year. Variable cost is Table to generate the values for the churt. (Hint: The Data estimated at $35 per customer. The hotel wants to break even if Table will need to track two output values the total costs 12,000 customers use the spa facility of the two alternatives. When setting up the Data Table, it (al Construct a spreadsheet model assuming that selling will simply have an additional column, compared to the price is an input to be specified by the uset. cuample presented in the text) (b) Use Goal Seek to find the selling price for which the hotel 5. Soe and Joe are a young married couple who are consider- will break even ing purchasing a new home. Their search has been reduced to 3. Gabriela Manufacturing must decide whether to insure three homes that they both like, at different location. They have (make) or cutoute buy) a new tosic free carpet deater that identified the factors they consider important and assigned a fac works with its Miracle Carpet Cleaning Machine. If it decides to for sure to cach location based on a 5-point scale. The informa insource the product, the process would incur 5300.000 of annual tion is shown in the table fixed costs and $150 per unit of variable costs. If it is outsourced. a supplier has offered to make it for an annual fixed cost of Factor Score at Each Location $120,000 and a variable cost of $2.25 per unit in variable costs. Location Location Location Factor al Construct a base-case spreadsheet model that shows both Factor 2 Weight of these alternatives side-by-side. Use the same number Proximity to of units (stored in a single cell) to drive the calculations work 1 10 (b) If the expected annual demand for the new deaner is Proximity to family 4 2 5 25 2 5 5 15 300,000 units, what would you recommend that Gabriela Sue of home Manufacturing dol Provide evidence to support your Transportation recommendation wiem 5 3 1 10 c) Use Goal Seck to find the indifference point where total Neighborhood 2 20 Cost 1 costs are equal) between these two alternatives. (Hint: Goal 2 4 20 natives CASE: DIET PLANNING A31 (a) Construct a spreadsheet model to help Sue and Joe make (d) Expand the model to calculate what is known as the root their decision. What is your recommendation! mean squared error or RMSE, which is a common mea (b) Construct a stacked column chart to illustrate the alter sure of forecast accuracy, RMSE is calculated as RMSE VEI, where is the forecast error for week i and his 6. The manager of a small health clinic needs to forecast de the total number of forecast crroes calculated. (Hint: To mand for laboratory services in the facility. Data from the last six ca value to a power in Excel use the carat ("Asymbol weeks are available and are respectively. 330, 350, 320, 370, 365, For example, the formula -B162"quire the value in and 343 tests. The manager decides to use a forecasting technique cell B16. Alus, you will need to use Excel's SORT function) known as the three-period moving average. For this technique e) Expand the model to calculate what is known as the the most recent three weeks' demands are averaged together to mean absolute percent error or MAPE, which is a com produce the forecast for the upcoming week. For example, wees mon measure of forecast accuracy, MAPE is essentially 1-3 are used to produce the forecast for weckt. the average percentage forecast error and is calculated as (a) Construct a spreadsheet model to help the manager for Slevy cast demand. Assume that this technique has been in MAPE where is the forecast error for week place in the previous weeks as well, and generate the fore isy, is the actual value for week and is the total num casted demand for week 7. You will not be able to gener ber of forecast crea calculated. ate forecasted demand for weeks 8. Custom Computers, Inc. assembles custom home computer (bExpand the modd to calculate the error in the forecast each systems. The heat sinks for the central processing units are weck. The error should be calculated as the actual demand bought for 512 cach and are ordered in quantities of 1300 units. for the week mins the forecasted demand. Which week had Annual demand is 5200 heat sinks the annual inventory holding the largest error? Which had the smallest errort What does it cost is $3 per unit, and the cost to place an order is estimated to mean that some enters are positive and some are negative? be s80. Assume that demand occurs continuously through the 7. Burger Lover Restaurant forecasts weekly sales of these year and that a new order is placed in time to the order arrives at burgers. The last five weeks of actual sales and forecasted sales are the same time as the previous inventory runs out. provided in the table. (a) Construct a base-case spreadsheet model to help analyze Week Actual Sales Forecast Sales different des quantities. The primary output of interest 1 354 320 is the total anulimientory-related cost comprising 2 315 3:40 total ordering cost and total holding cost. Holding cont 3 367 380 can be applied to the average inventory level through the 4 322 366 year. Given the assumption about continuously occurring 356 demand and that orders arrive just in time, the average inventory levd will be half of the order quantity (a) Construct a sprcadsheet model to compute the forecast (b) For the base-case order quantity of 1500 heat sinks, what crror for cach week. The forecast error is defined to be the is the average inventory level, the number of orders actual sales minus the forecasted sales and can be positive placed per year, the total annual inventory holding cost. or negative. the total anual ordering cost, and the total annual cost? (b) Explain the meaning of positive and negative forecast (c) Repeat (b) for an order quantity of 650 heat sinks. Repeat error for 1950 heat sinks (c) Expand the model to calculate what is known as the (d) The Economic Order Quantity EOQ) is defined as the mean absolute deviation, or MAD, which is a common order quantity that minimizes total inventory-related measure of forecast accuracy, MAD is calculated as costs. Construct a Data Table and an XY chart and find MAD-Sle, where is the forecast error for week the EOQ for this situation and it is the total number of forecast errors calculated. (e) How much would ordering the EOQ save Custom Com (Hint: You will need to use Excel's ABS function to com puterns on an annual basis, compared to its current ordet pute the absolute values of the errors) quantity? 390 CASE: Diet Planning Given your busy schedule, you cat many meals on the go. Lately you've started to get concerned about the nutritional value of all those burger and fries lunche. You decide to build a model to help you decide ahead of time on a reasonably nutritious diet for a single day at your favorite restaurant. A number of restaurants (c-. Burger King. McDonald's, Wendy's) have nutritional data for their menu items mailable on the Web In some cases these are essentially electronic versions of their printed nutritional brochures in other cases they are in a form that you can copy and paste into an Excel spreadsheet