Answered step by step
Verified Expert Solution
Link Copied!

Question

1 Approved Answer

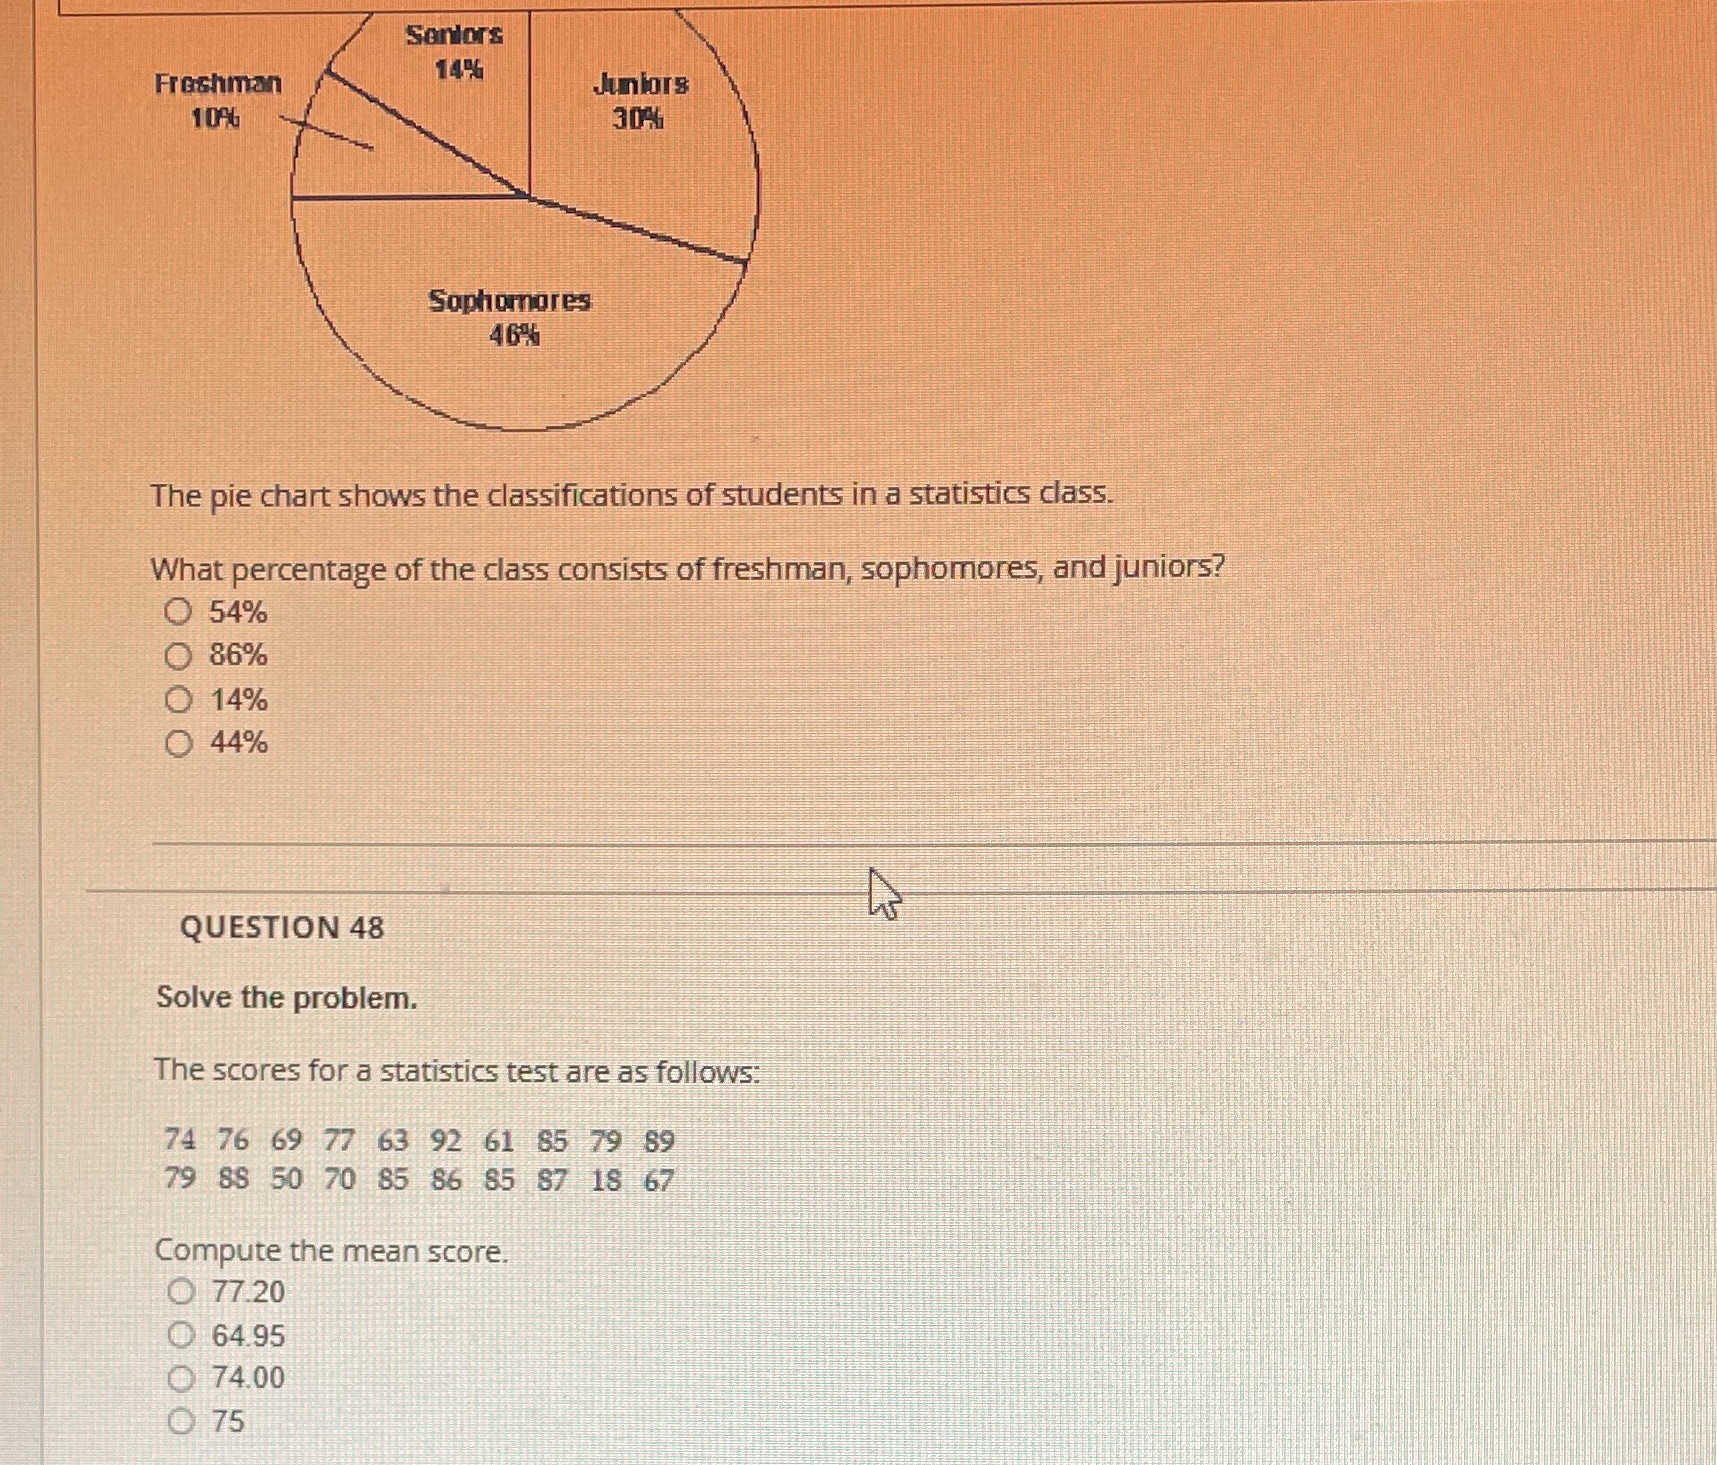
Please answer both! Sanlors Freshman 146 Juniors 104 30%% Sophomores 46% The pie chart shows the classifications of students in a statistics class. What percentage

Please answer both!

image text in transcribed
Sanlors Freshman 146 Juniors 104 30%% Sophomores 46% The pie chart shows the classifications of students in a statistics class. What percentage of the class consists of freshman, sophomores, and juniors? O 54% O 86% O 14% O 44% QUESTION 48 Solve the problem. The scores for a statistics test are as follows: 74 76 69 77 63 92 61 85 79 89 79 88 50 70 85 86 85 87 18 67 Compute the mean score. O 77.20 64.95 74.00 O 75

Step by Step Solution

There are 3 Steps involved in it

Step: 1

blur-text-image

Get Instant Access to Expert-Tailored Solutions

See step-by-step solutions with expert insights and AI powered tools for academic success

Step: 2

blur-text-image

Step: 3

blur-text-image

Ace Your Homework with AI

Get the answers you need in no time with our AI-driven, step-by-step assistance

Get Started

Recommended Textbook for

Introduction To Probability Models

Authors: Sheldon M Ross

12th Edition

0128143460, 9780128143469

More Books

Students also viewed these Mathematics questions

Question

Where did the faculty member get his/her education? What field?

Answered: 1 week ago