Answered step by step
Verified Expert Solution
Question
1 Approved Answer
Please answer + code on Matlab... The file is written below hw6_data %The first column is time in days and the second one is measured
Please answer + code on Matlab... The file is written below

"hw6_data"
%The first column is time in days and the second one is measured virus concentration
data=[-10 131334 -9 130748 -8 130223 -7 132089 -6 134453 -5 133575 -4 132779 -3 132123 -2 131524 -1 130300 0 133230 1 133089 2 98668 3 73080 4 53579 5 39405 6 28333 7 19182 8 14888 9 12405 10 8043 11 6249 12 4939 13 2440 14 2003];
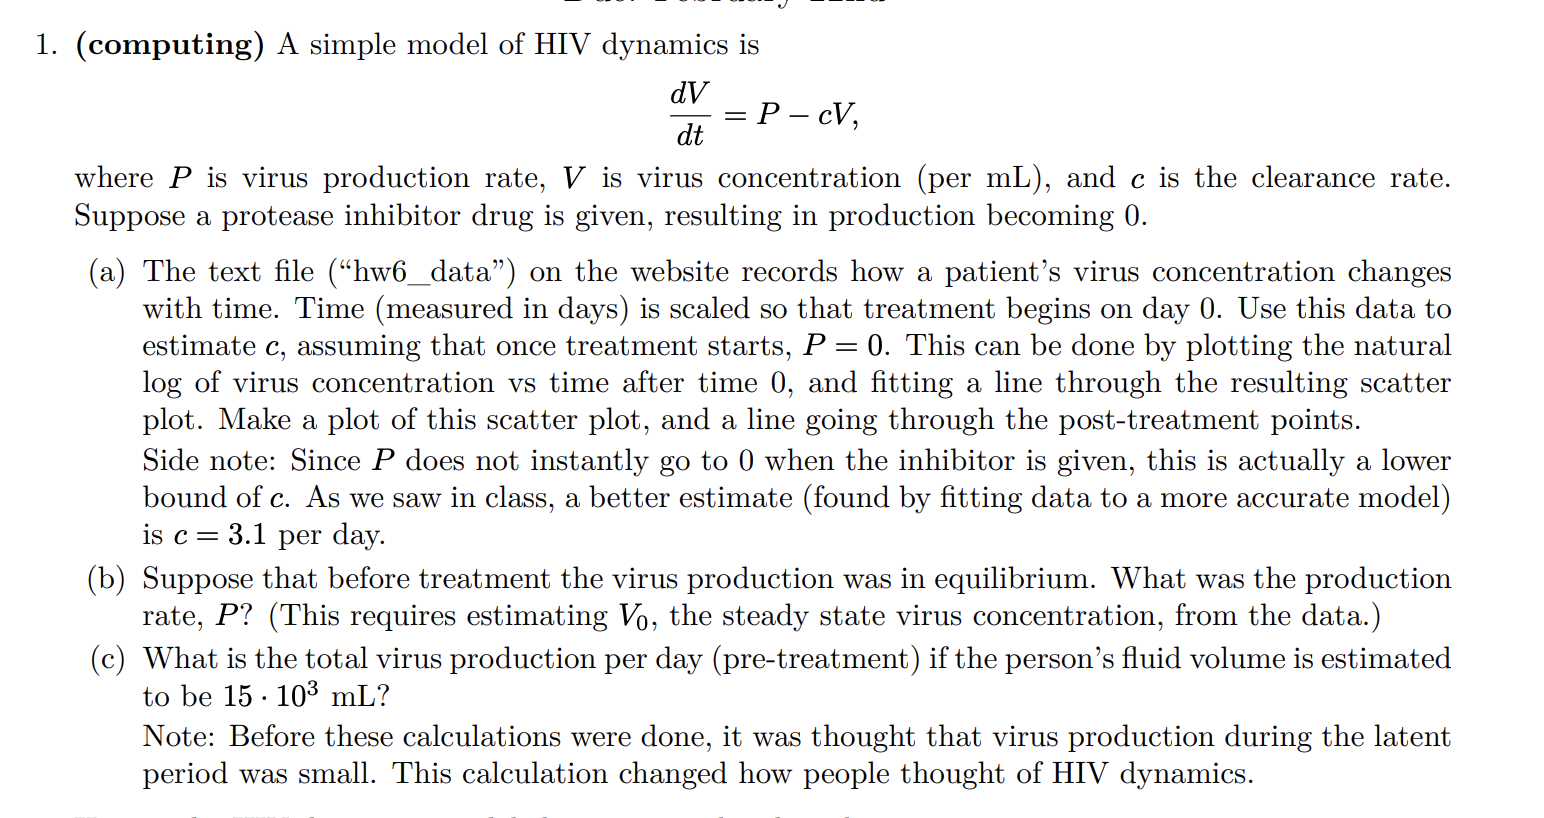
1. (computing) A simple model of HIV dynamics is dtdV=PcV, where P is virus production rate, V is virus concentration (per mL ), and c is the clearance rate. Suppose a protease inhibitor drug is given, resulting in production becoming 0 . (a) The text file ("hw6_data") on the website records how a patient's virus concentration changes with time. Time (measured in days) is scaled so that treatment begins on day 0 . Use this data to estimate c, assuming that once treatment starts, P=0. This can be done by plotting the natural log of virus concentration vs time after time 0 , and fitting a line through the resulting scatter plot. Make a plot of this scatter plot, and a line going through the post-treatment points. Side note: Since P does not instantly go to 0 when the inhibitor is given, this is actually a lower bound of c. As we saw in class, a better estimate (found by fitting data to a more accurate model) is c=3.1 per day. (b) Suppose that before treatment the virus production was in equilibrium. What was the production rate, P ? (This requires estimating V0, the steady state virus concentration, from the data.) (c) What is the total virus production per day (pre-treatment) if the person's fluid volume is estimated to be 15103mL ? Note: Before these calculations were done, it was thought that virus production during the latent period was small. This calculation changed how people thought of HIV dynamicsStep by Step Solution
There are 3 Steps involved in it
Step: 1

Get Instant Access to Expert-Tailored Solutions
See step-by-step solutions with expert insights and AI powered tools for academic success
Step: 2

Step: 3

Ace Your Homework with AI
Get the answers you need in no time with our AI-driven, step-by-step assistance
Get Started


