

Answered step by step
Verified Expert Solution
Question
1 Approved Answer
please answer everythingi beg you! i dont have more questions remaining. Horizontal Analysis of the Income Statement Income statement data for Winthrop Company for two
please answer everythingi beg you! i dont have more questions remaining.
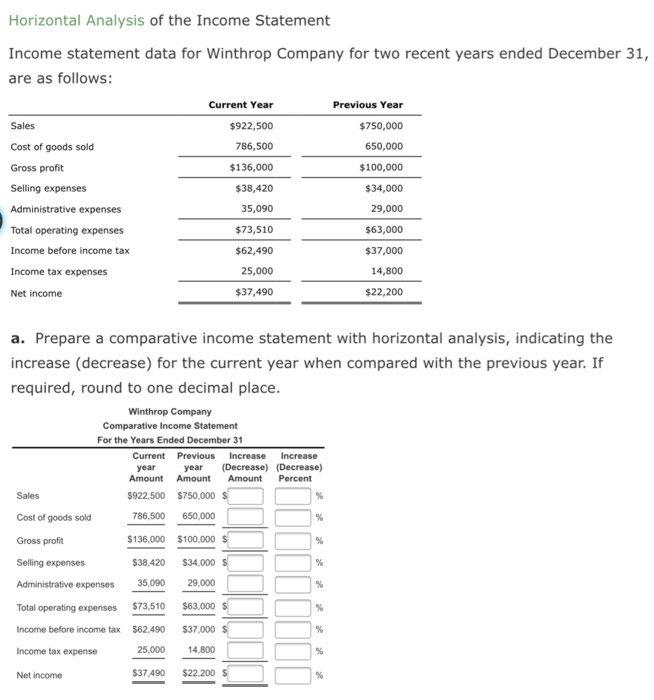
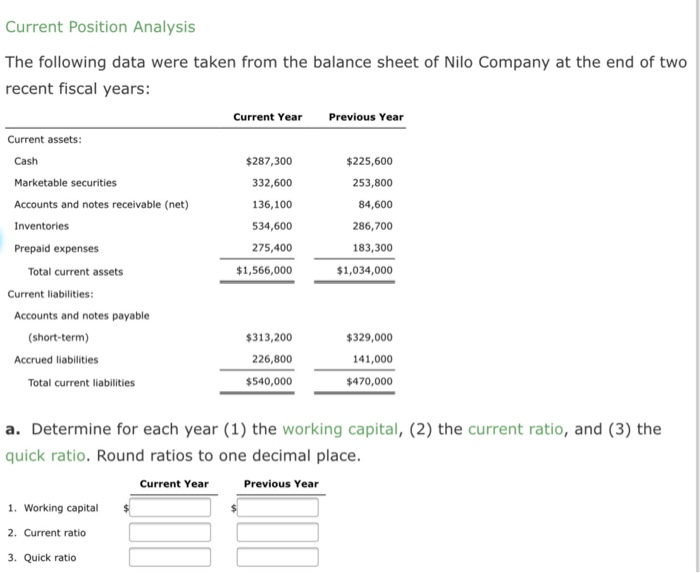
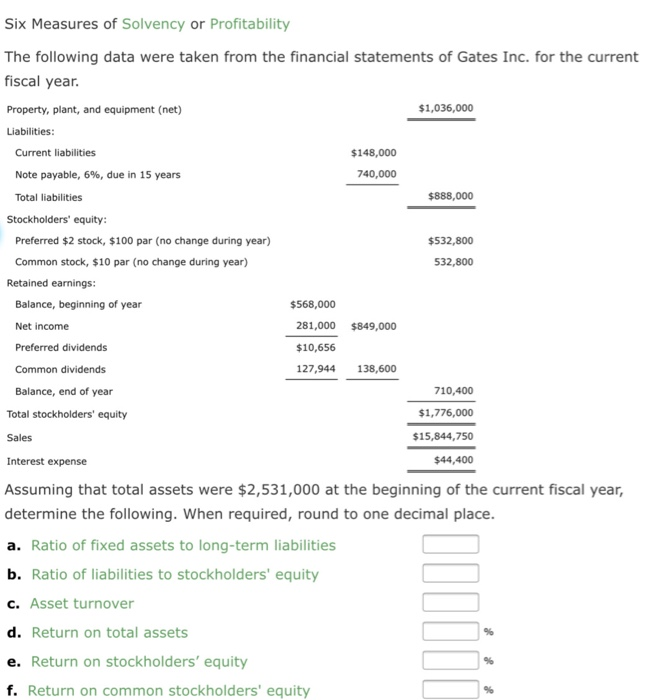
Horizontal Analysis of the Income Statement Income statement data for Winthrop Company for two recent years ended December 31, are as follows: Current Year Previous Year Sales $922,500 $750,000 650,000 Cost of goods sold 786,500 Gross profit $136,000 $100,000 Selling expenses $38,420 $34,000 29,000 Administrative expenses 35,090 Total operating expenses $73,510 $63,000 Income before income tax $37,000 Income tax expenses $62,490 25,000 $37,490 14,800 Net income $22,200 a. Prepare a comparative income statement with horizontal analysis, indicating the increase (decrease) for the current year when compared with the previous year. If required, round to one decimal place. Winthrop Company Comparative Income Statement For the Years Ended December 31 Current Previous Increase Increase year year (Decrease) (Decrease) Amount Amount Amount Percent Sales $922,500 $750,000 $ Cost of goods sold 786,500 650.000 Gross profit $136.000 $100,000 Selling expenses $38,420 $34,000 Administrative expenses 35,090 29,000 Total operating expenses $73,510 $63,000 $ Income before income tax $37,000 $ $62,490 25,000 Income tax expense 14,800 Net income $37.490 $22.200 Current Position Analysis The following data were taken from the balance sheet of Nilo Company at the end of two recent fiscal years: Current Year Previous Year Current assets: Cash $225,600 Marketable securities Accounts and notes receivable (net) $287,300 332,600 136,100 534,600 275,400 $1,566,000 253,800 84,600 286,700 183,300 Inventories Prepaid expenses Total current assets $1,034,000 Current liabilities: Accounts and notes payable (short-term) Accrued liabilities Total current liabilities $313,200 226,800 $540,000 $329,000 141,000 $470,000 a. Determine for each year (1) the working capital, (2) the current ratio, and (3) the quick ratio. Round ratios to one decimal place. Current Year Previous Year 1. Working capital 2. Current ratio 3. Quick ratio Six Measures of Solvency or Profitability The following data were taken from the financial statements of Gates Inc. for the current fiscal year. Property, plant, and equipment (net) $1,036,000 Liabilities: Current liabilities $148,000 Note payable, 6%, due in 15 years 740,000 Total liabilities $888,000 Stockholders' equity: Preferred $2 stock, $100 par (no change during year) Common stock, $10 par (no change during year) Retained earnings: $532,800 532,800 Balance, beginning of year $568,000 Net income 281,000 $849,000 Preferred dividends $10,656 Common dividends 127,944 138,600 Balance, end of year 710,400 Total stockholders' equity $1,776,000 Sales $15,844,750 Interest expense $44,400 Assuming that total assets were $2,531,000 at the beginning of the current fiscal year, determine the following. When required, round to one decimal place. a. Ratio of fixed assets to long-term liabilities b. Ratio of liabilities to stockholders' equity c. Asset turnover d. Return on total assets e. Return on stockholders' equity f. Return on common stockholders' equity Step by Step Solution
There are 3 Steps involved in it
Step: 1

Get Instant Access to Expert-Tailored Solutions
See step-by-step solutions with expert insights and AI powered tools for academic success
Step: 2

Step: 3
Ace Your Homework with AI
Get the answers you need in no time with our AI-driven, step-by-step assistance
Get Started
Cases In Auditing
Authors: Josephine Maltby
2nd Edition
1853963127, 978-1853963124