Answered step by step
Verified Expert Solution
Question
1 Approved Answer
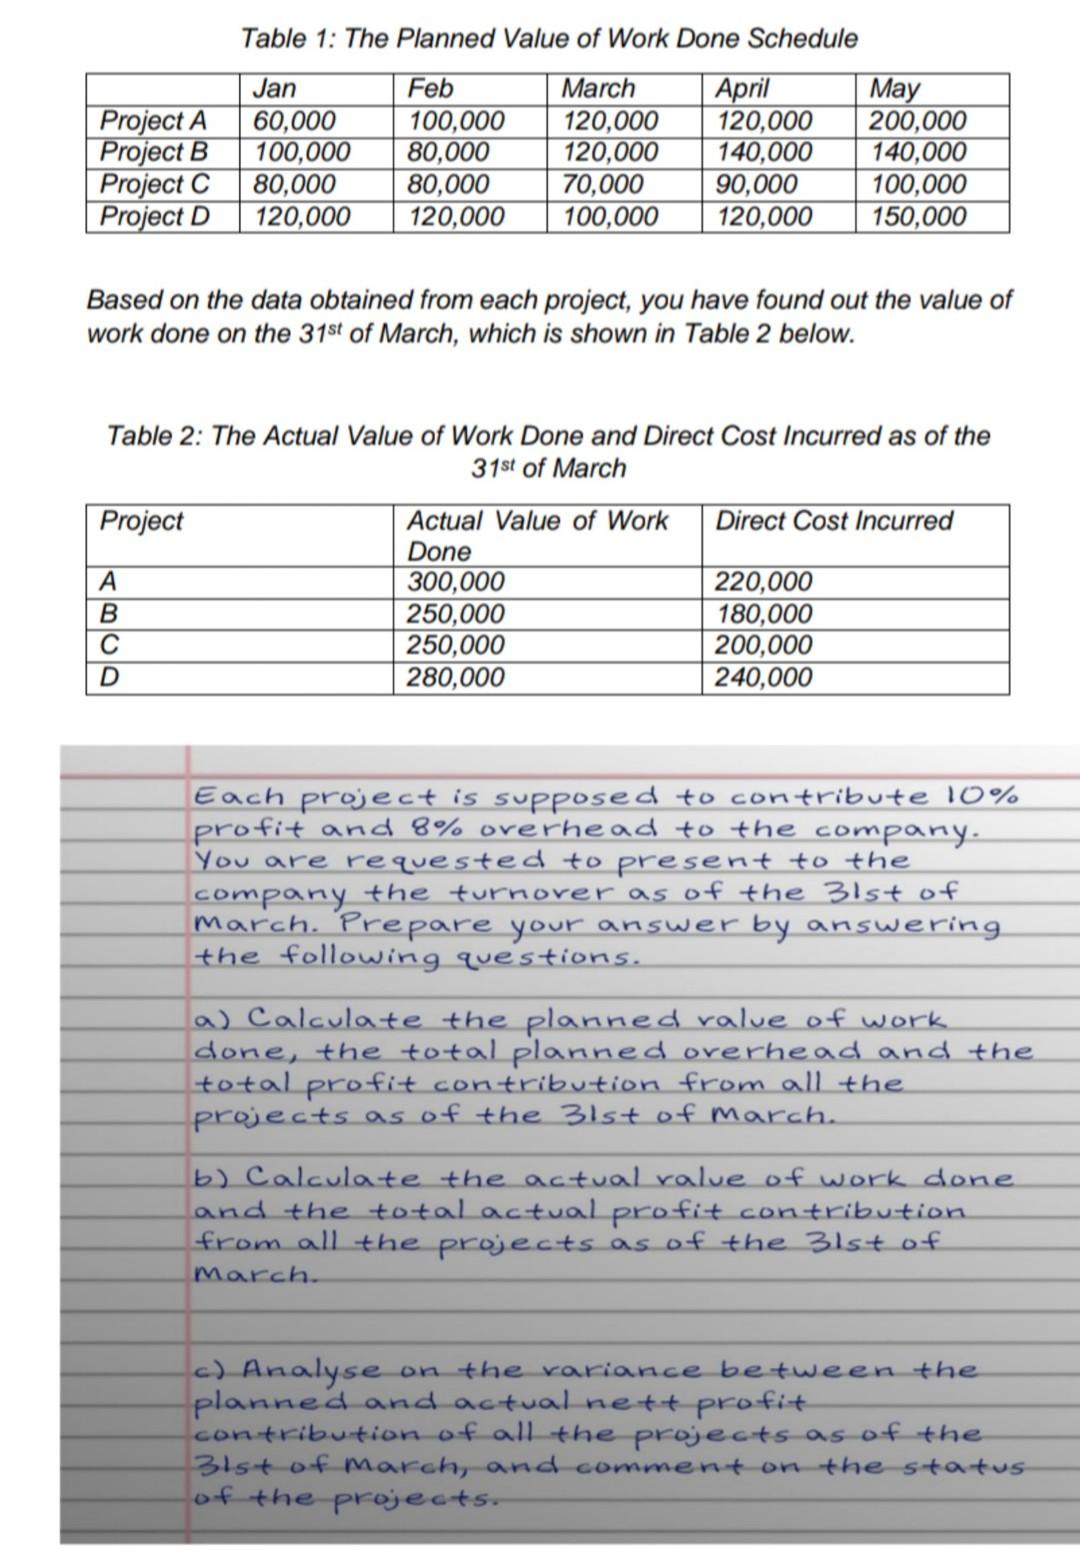
Please answer fast Table 1: The Planned Value of Work Done Schedule Project A Project B Project C Project D Jan 60,000 100,000 80,000 120,000

Please answer fast
Table 1: The Planned Value of Work Done Schedule Project A Project B Project C Project D Jan 60,000 100,000 80,000 120,000 Feb 100,000 80,000 80,000 120,000 March 120,000 120,000 70,000 100,000 April 120,000 140,000 90,000 120,000 May 200,000 140,000 100,000 150,000 Based on the data obtained from each project, you have found out the value of work done on the 31st of March, which is shown in Table 2 below. Table 2: The Actual Value of Work Done and Direct Cost Incurred as of the 31st of March Project Direct Cost Incurred B D Actual Value of Work Done 300,000 250,000 250,000 280,000 220,000 180,000 200,000 240,000 Each project is supposed to contribute 10% profit and 8% overhead to the company. You are requested to present to the company the turnover as of the 31st of march. Prepare your answer by answering the following questions. a) Calculate the planned value of work done, the total planned overhead and the total profit contribution from all the projects as of the 31st of March b) Calculate the actual ralue of work done. and the total actual profit contribution from all the projects as of the 31st of march. c) Analyse on the variance between the planned and actual nett profit contribution of all the projects as of the 31st of march, and comment on the status of the projectsStep by Step Solution
There are 3 Steps involved in it
Step: 1

Get Instant Access to Expert-Tailored Solutions
See step-by-step solutions with expert insights and AI powered tools for academic success
Step: 2

Step: 3

Ace Your Homework with AI
Get the answers you need in no time with our AI-driven, step-by-step assistance
Get Started


