Please answer following
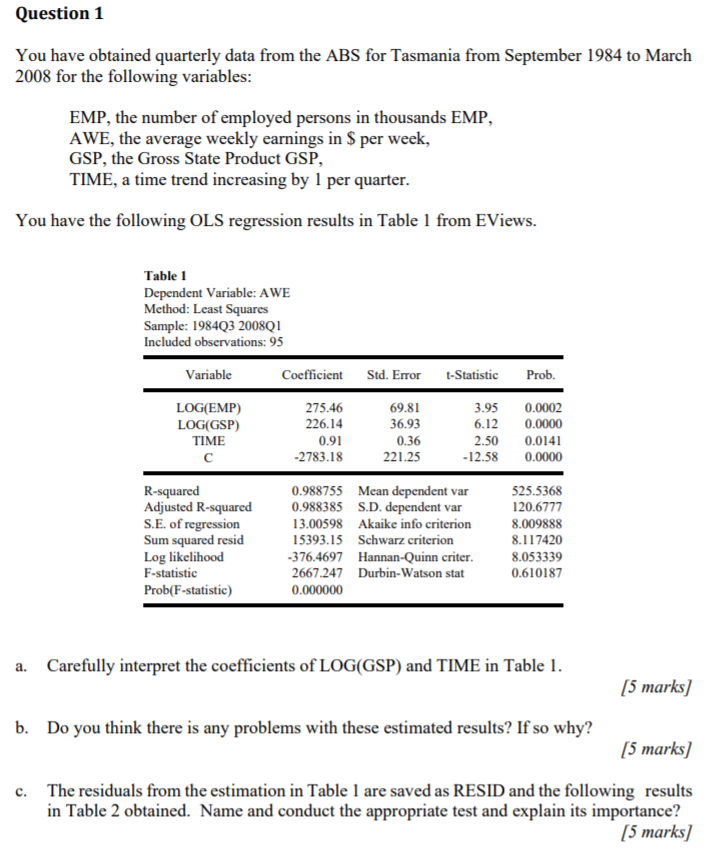
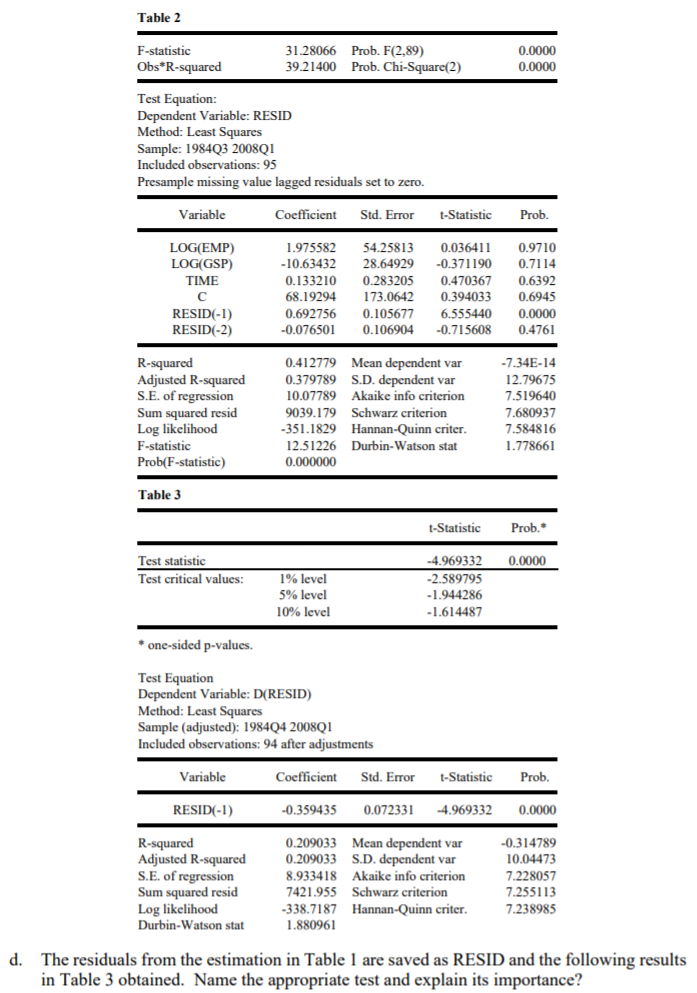
Question 1 You have obtained quarterly data from the ABS for Tasmania from September 1984 to March 2008 for the following variables: EMP, the number of employed persons in thousands EMP, AWE, the average weekly earnings in $ per week, GSP, the Gross State Product GSP, TIME, a time trend increasing by 1 per quarter. You have the following OLS regression results in Table 1 from EViews. Table 1 Dependent Variable: AWE Method: Least Squares Sample: 1984Q3 200801 Included observations: 95 Variable Coefficient Std. Error t-Statistic Prob LOG(EMP) 275.46 69.81 3.95 0.0002 LOG(GSP) 226.14 36.93 6.12 0.0000 TIME 0.91 0.36 2.50 0.0141 C -2783.18 221.25 -12.58 0.0000 R-squared 0.988755 Mean dependent var 525.5368 Adjusted R-squared 0.988385 S.D. dependent var 120.6777 S.E. of regression 13.00598 Akaike info criterion 8.009888 Sum squared resid 15393.15 Schwarz criterion 8.117420 Log likelihood -376.4697 Hannan-Quinn criter. 8.053339 F-statistic 2667.247 Durbin-Watson stat 0.610187 Prob(F-statistic) 0.000000 a. Carefully interpret the coefficients of LOG(GSP) and TIME in Table 1. [5 marks] b. Do you think there is any problems with these estimated results? If so why? [5 marks] c. The residuals from the estimation in Table 1 are saved as RESID and the following results in Table 2 obtained. Name and conduct the appropriate test and explain its importance? [5 marks]Table 2 F-statistic 31.28066 Prob. F(2,89) 0.0000 Obs*R-squared 39.21400 Prob. Chi-Square(2) 0.0000 Test Equation: Dependent Variable: RESID Method: Least Squares Sample: 1984Q3 200801 Included observations: 95 Presample missing value lagged residuals set to zero. Variable Coefficient Std. Error t-Statistic Prob. LOG(EMP) 1.975582 54.25813 0.036411 0.9710 LOG(GSP) -10.63432 28.64929 -0.371190 0.7114 TIME 0.133210 0.283205 0.470367 0.6392 C 68.19294 173.0642 0.394033 0.6945 RESID(-1) 0.692756 0.105677 6.555440 0.0000 RESID(-2) -0.076501 0.106904 -0.715608 0.4761 R-squared 0.412779 Mean dependent var -7.34E-14 Adjusted R-squared 0.379789 S.D. dependent var 12.79675 S.E. of regression 10.07789 Akaike info criterion 7.519640 Sum squared resid 9039.179 Schwarz criterion 7.680937 Log likelihood -351.1829 Hannan-Quinn criter. 7.584816 F-statistic 12.51226 Durbin-Watson stat 1.778661 Prob(F-statistic) 0.000000 Table 3 t-Statistic Prob.* Test statistic -4.969332 0.0000 Test critical values: 1% level 2.589795 5% level -1.944286 10% level -1.614487 * one-sided p-values. Test Equation Dependent Variable: D(RESID Method: Least Squares Sample (adjusted): 198404 2008Q1 Included observations: 94 after adjustments Variable Coefficient Std. Error t-Statistic Prob. RESID(-1) -0.359435 0.072331 -4.969332 0.0000 R-squared 0.209033 Mean dependent var -0.314789 Adjusted R-squared 0.209033 S.D. dependent var 10.04473 S.E. of regression 8.933418 Akaike info criterion 7.228057 Sum squared resid 7421.955 Schwarz criterion 7.255113 Log likelihood -338.7187 Hannan-Quinn criter. 7.238985 Durbin-Watson stat 1.880961 d. The residuals from the estimation in Table 1 are saved as RESID and the following results in Table 3 obtained. Name the appropriate test and explain its importance