

Question: Please answer from 5.1 to 5.8 while showing your work so I could understand. Thank you 125% View Zoom Add Page Insert Table Chart Text
Please answer from 5.1 to 5.8 while showing your work so I could understand. Thank you
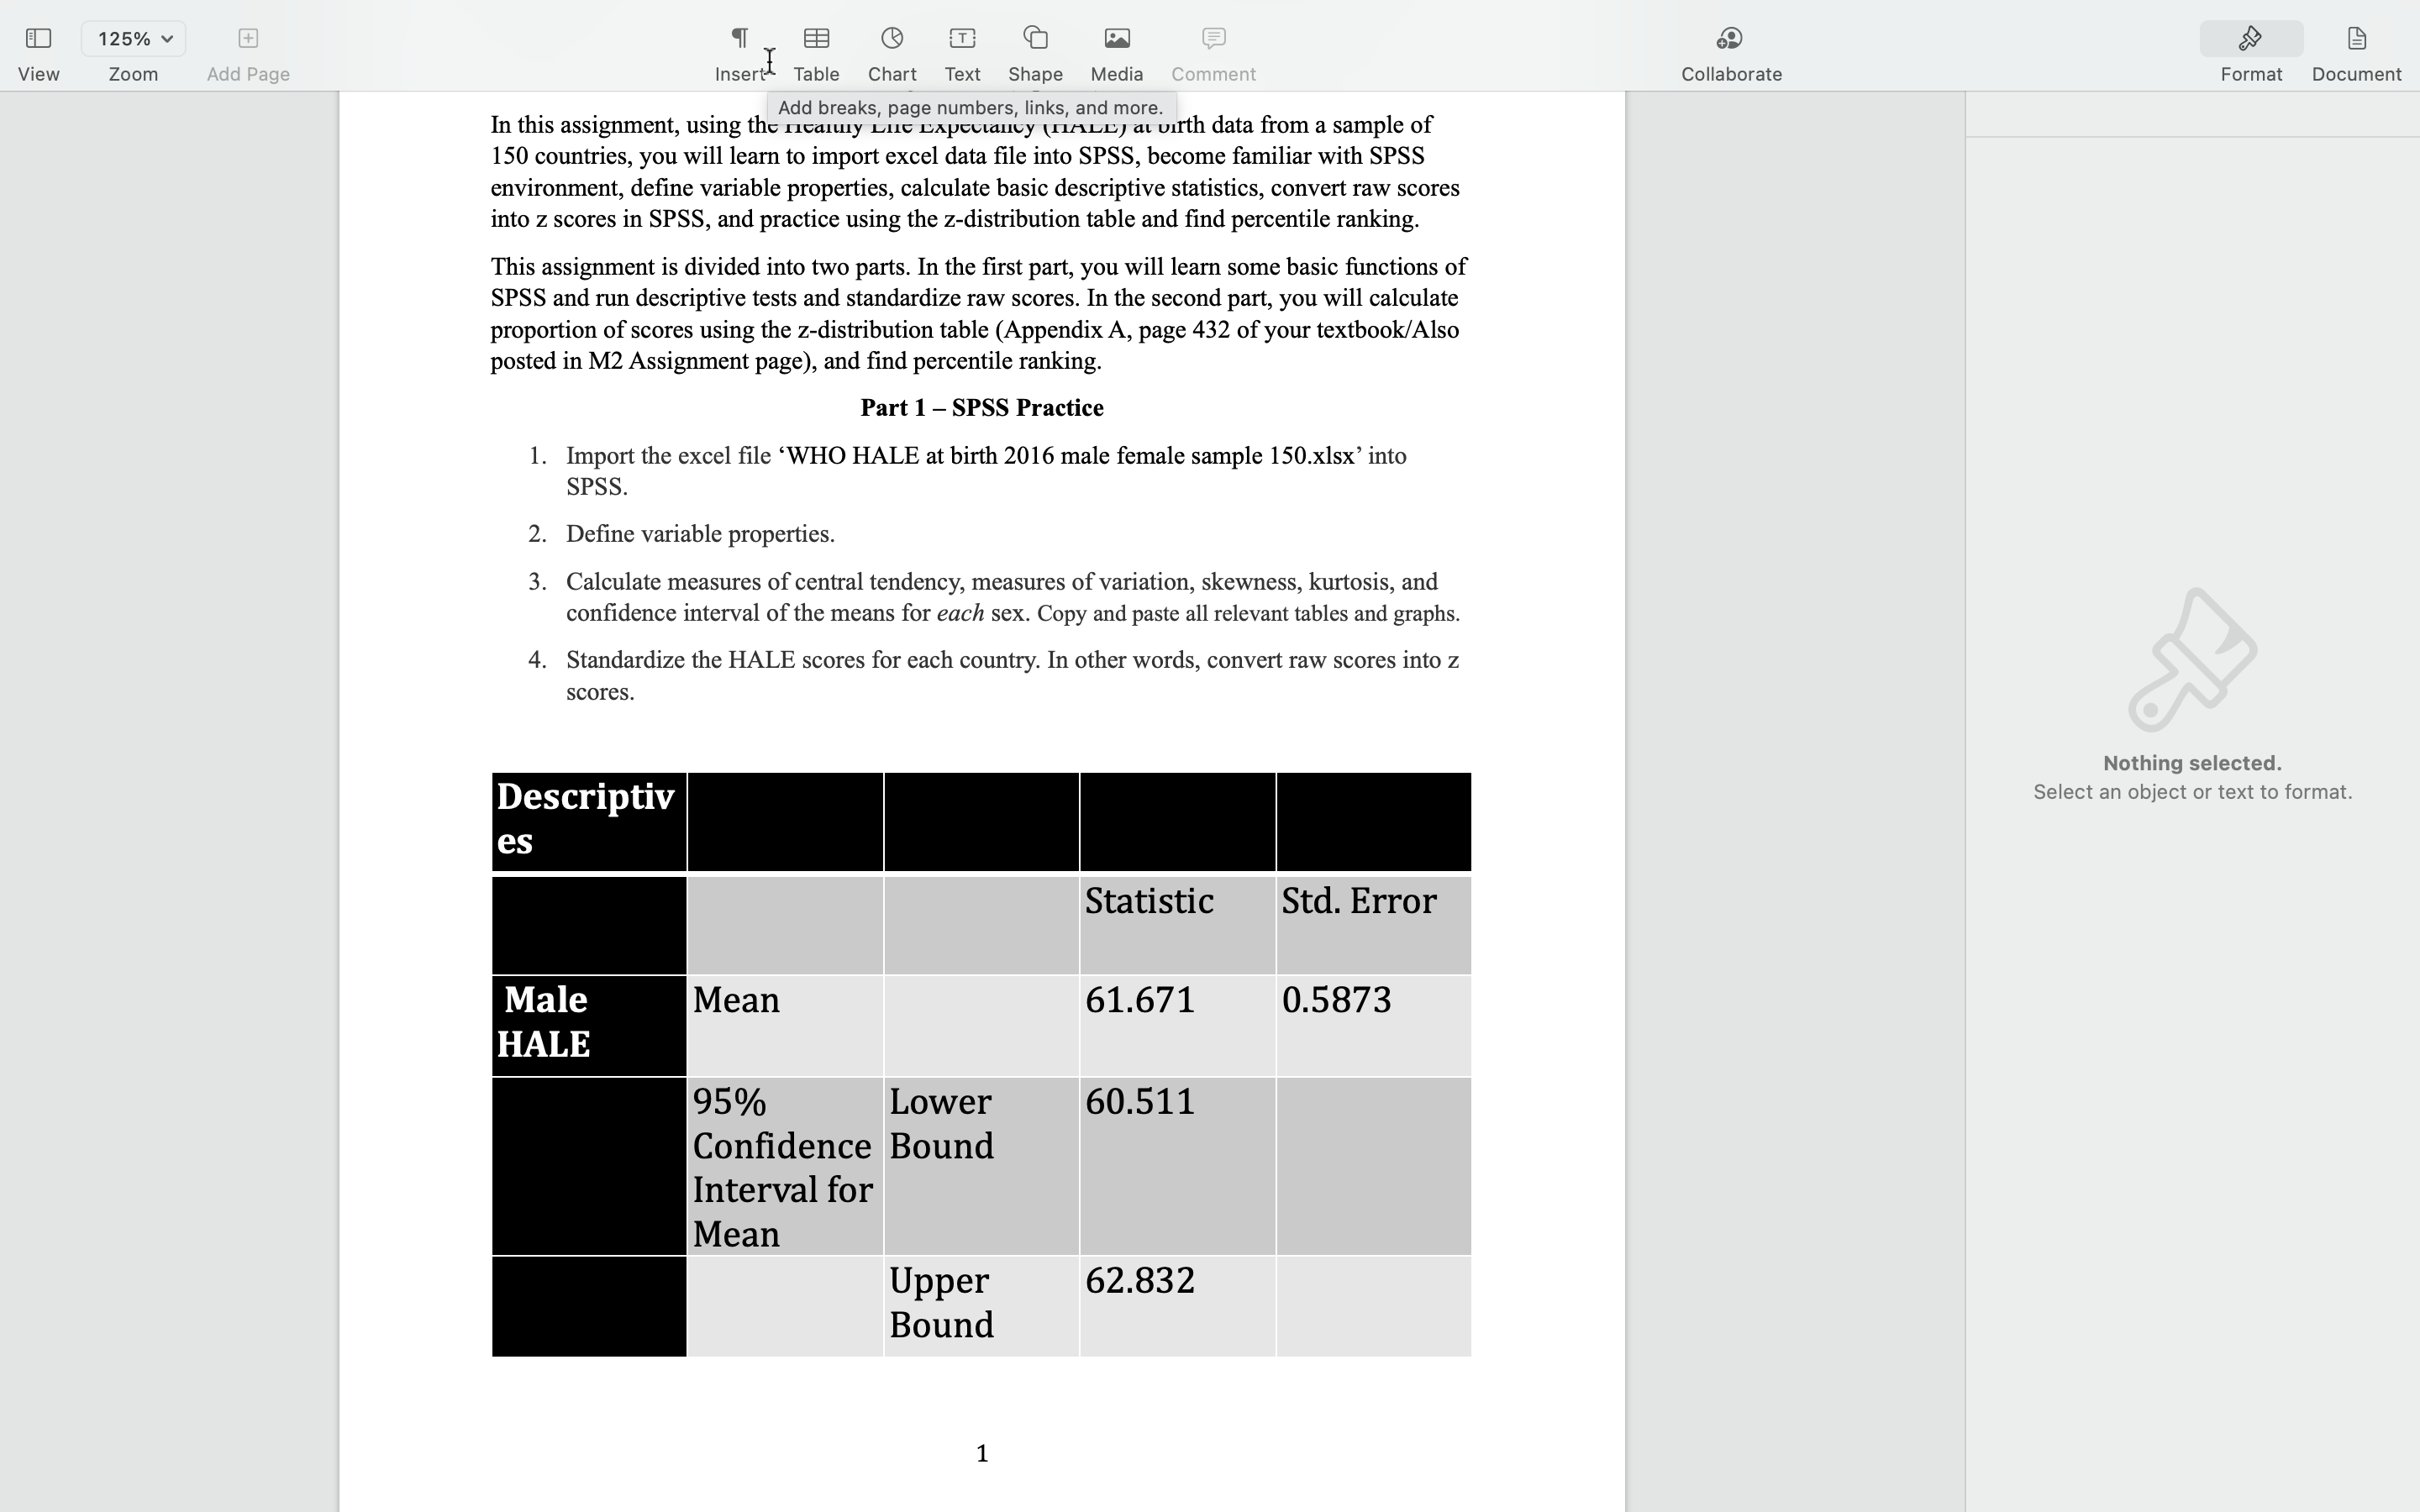
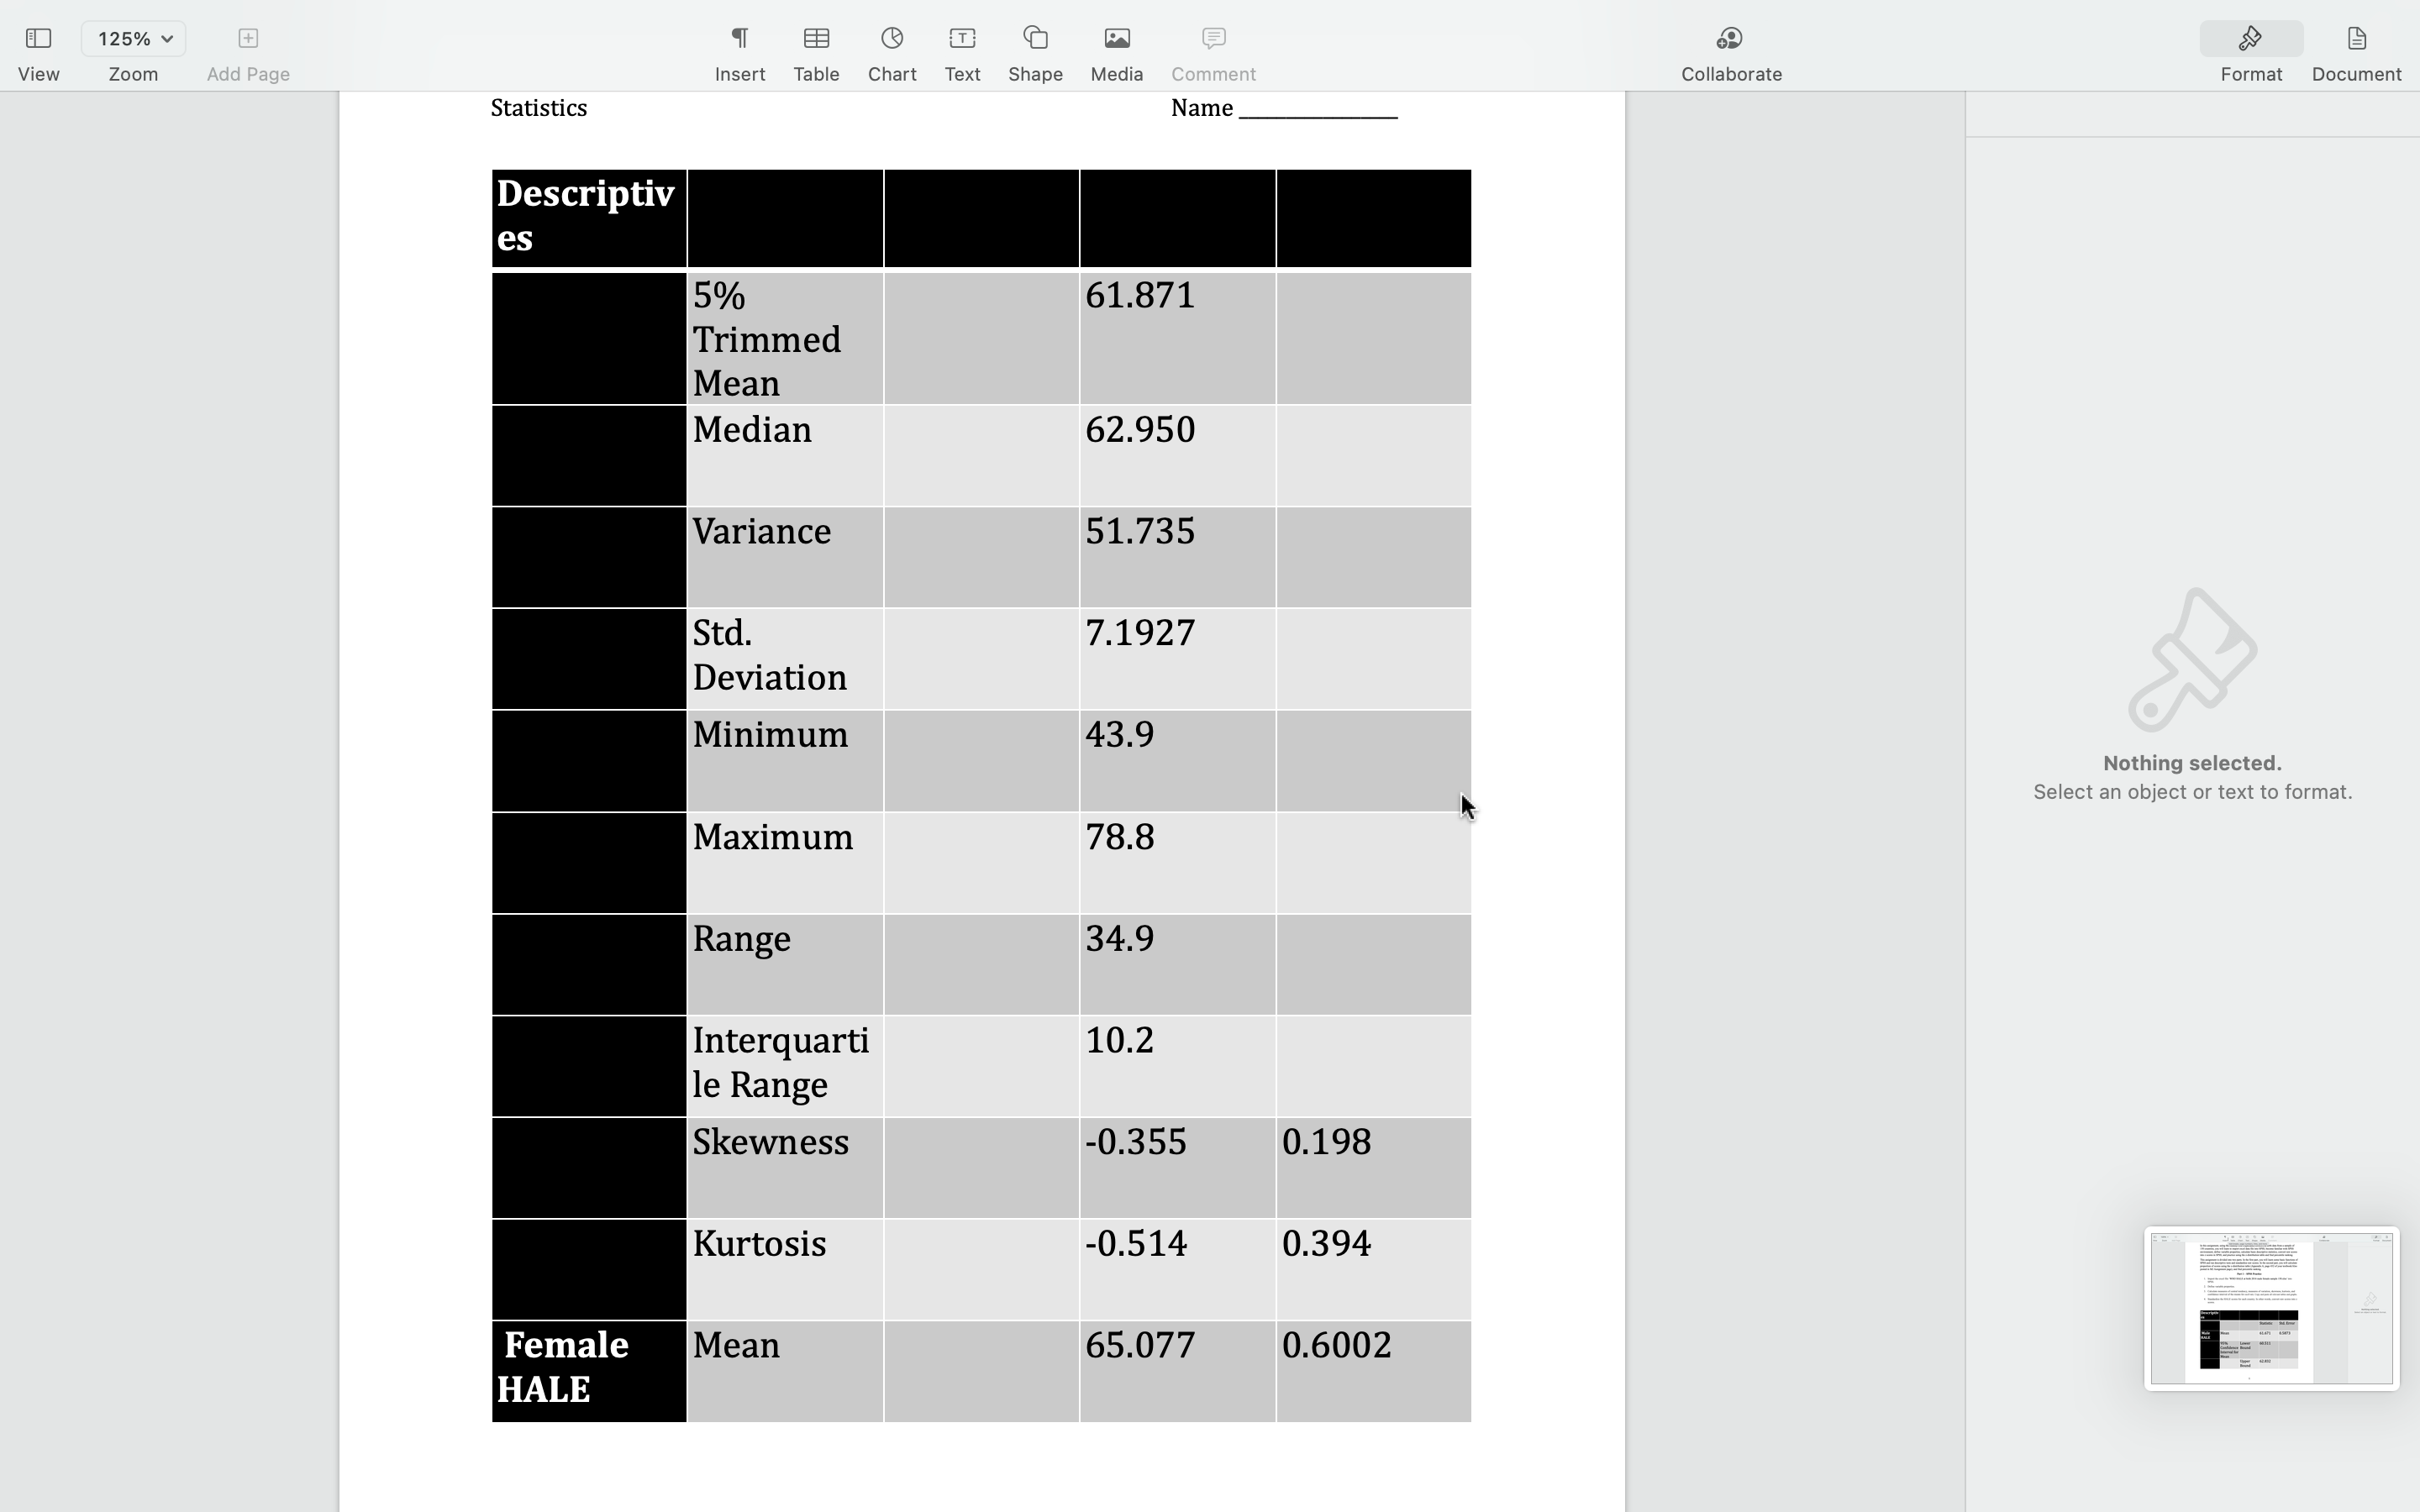
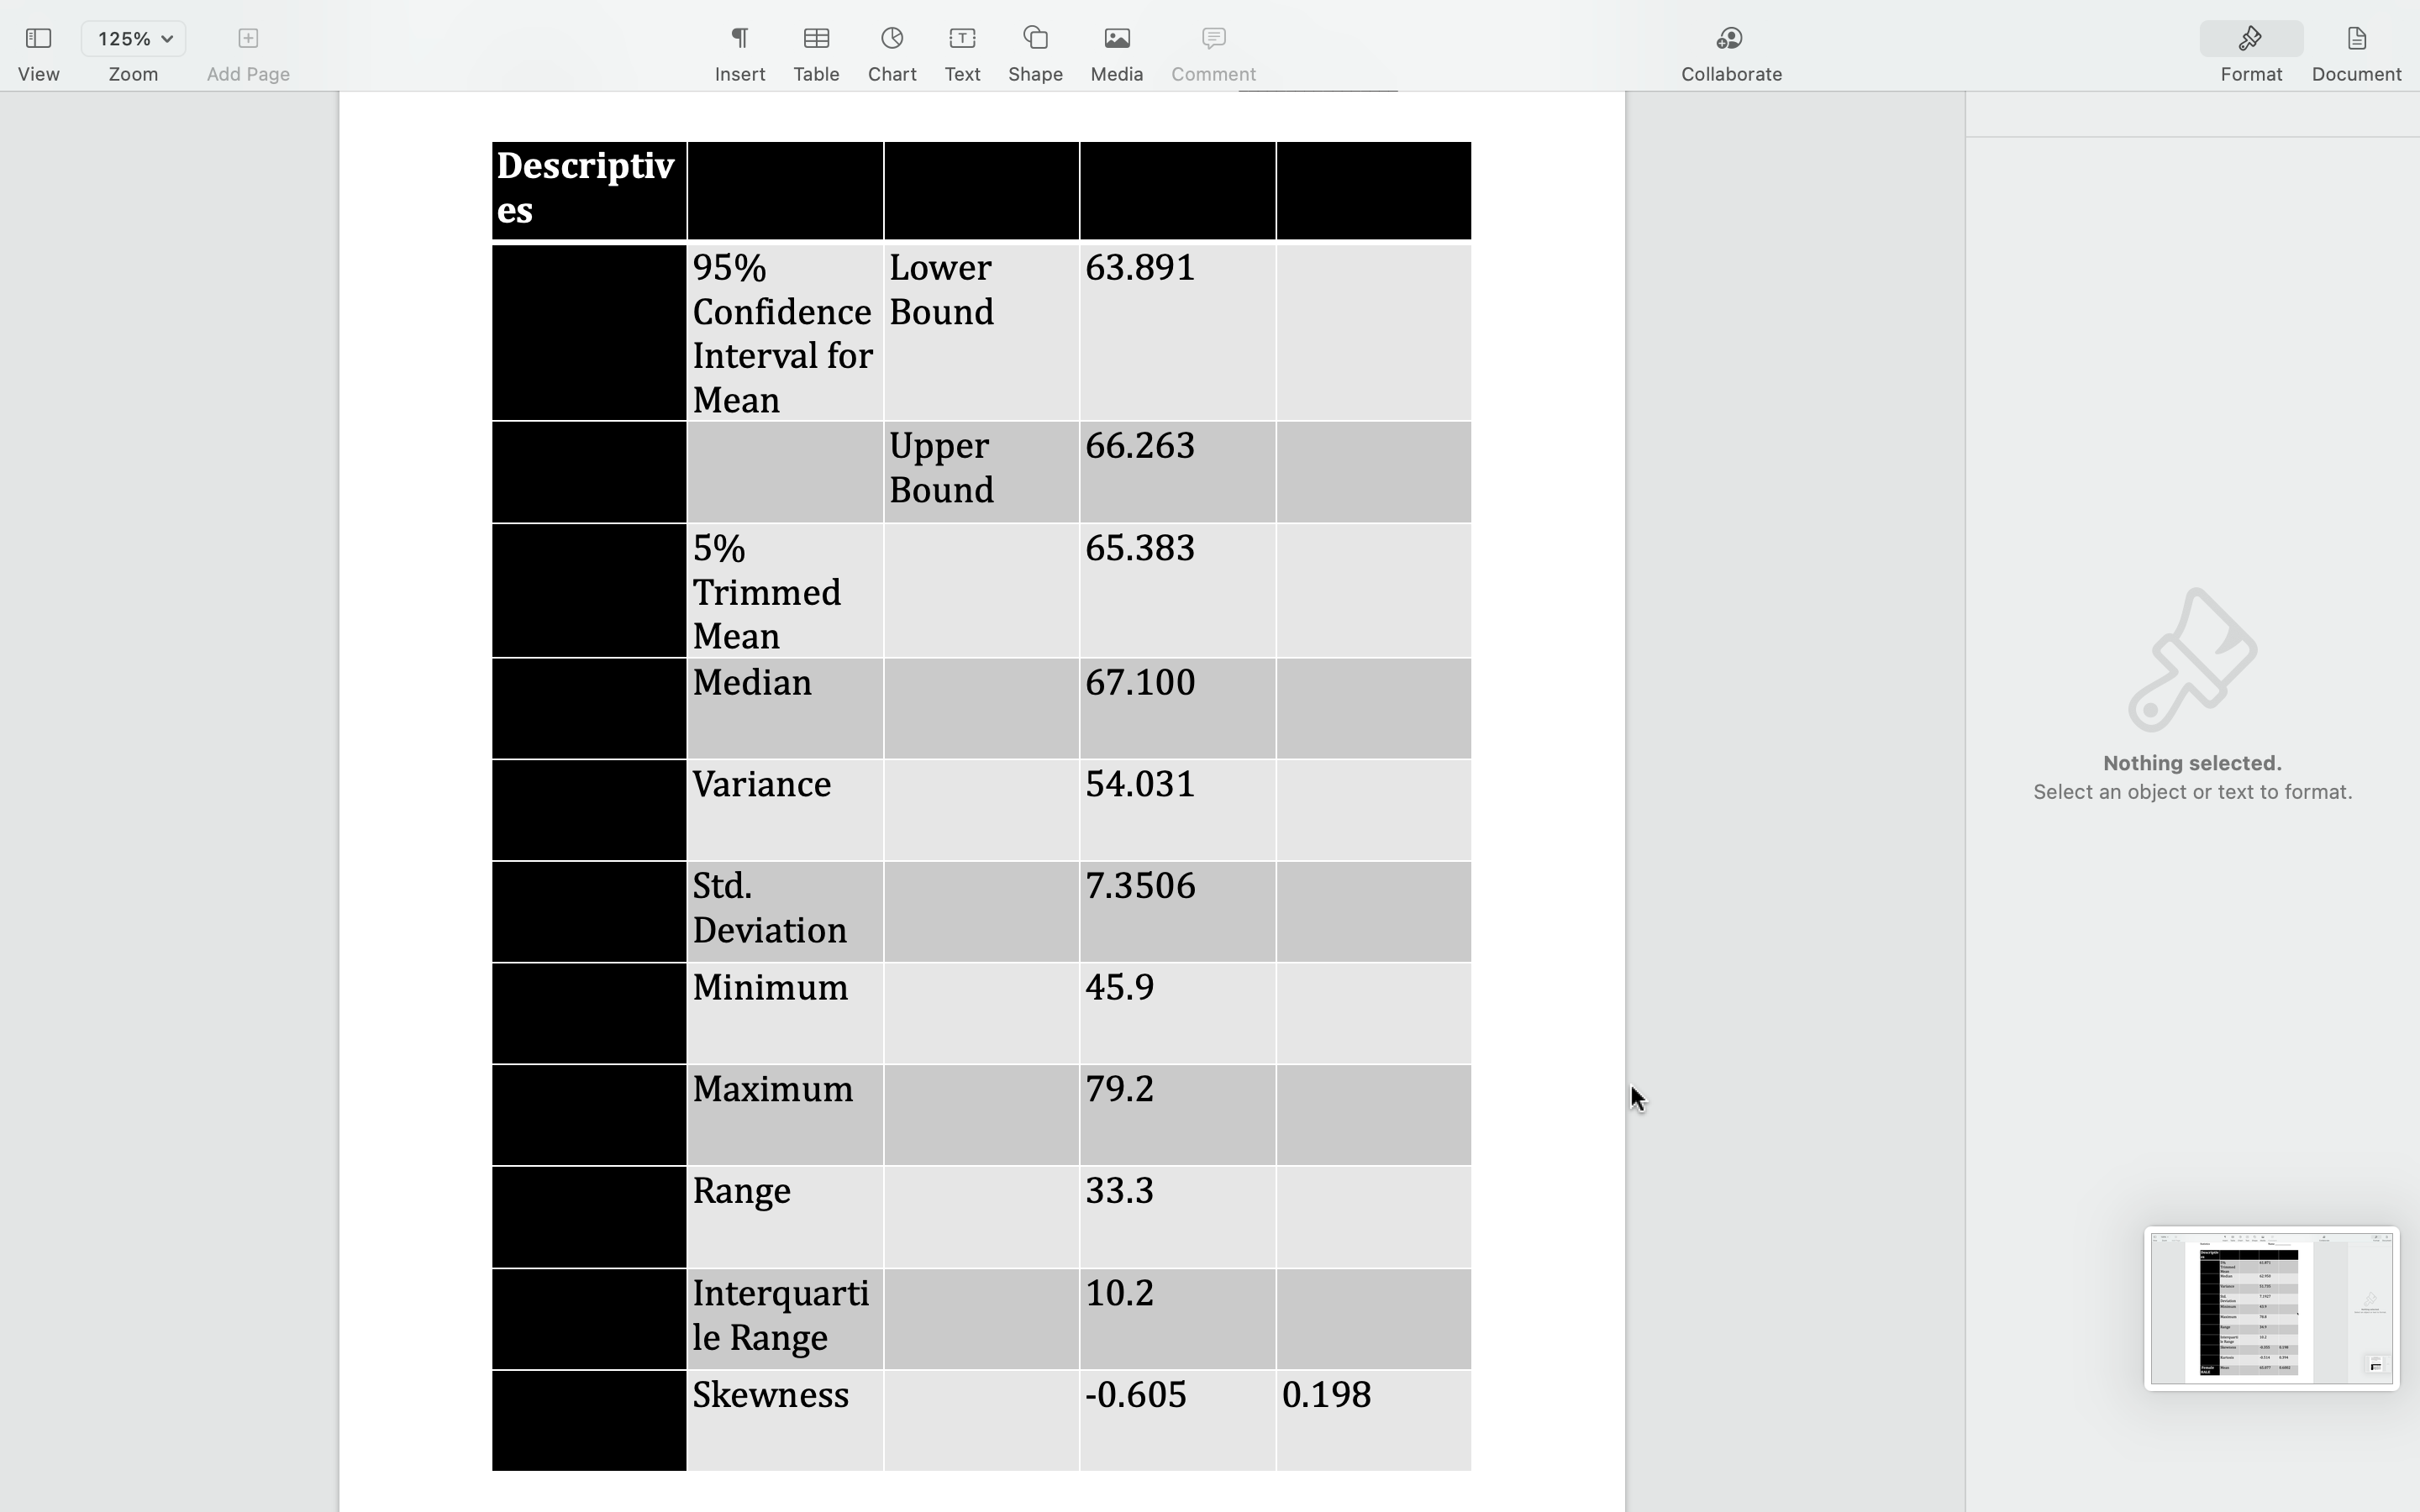
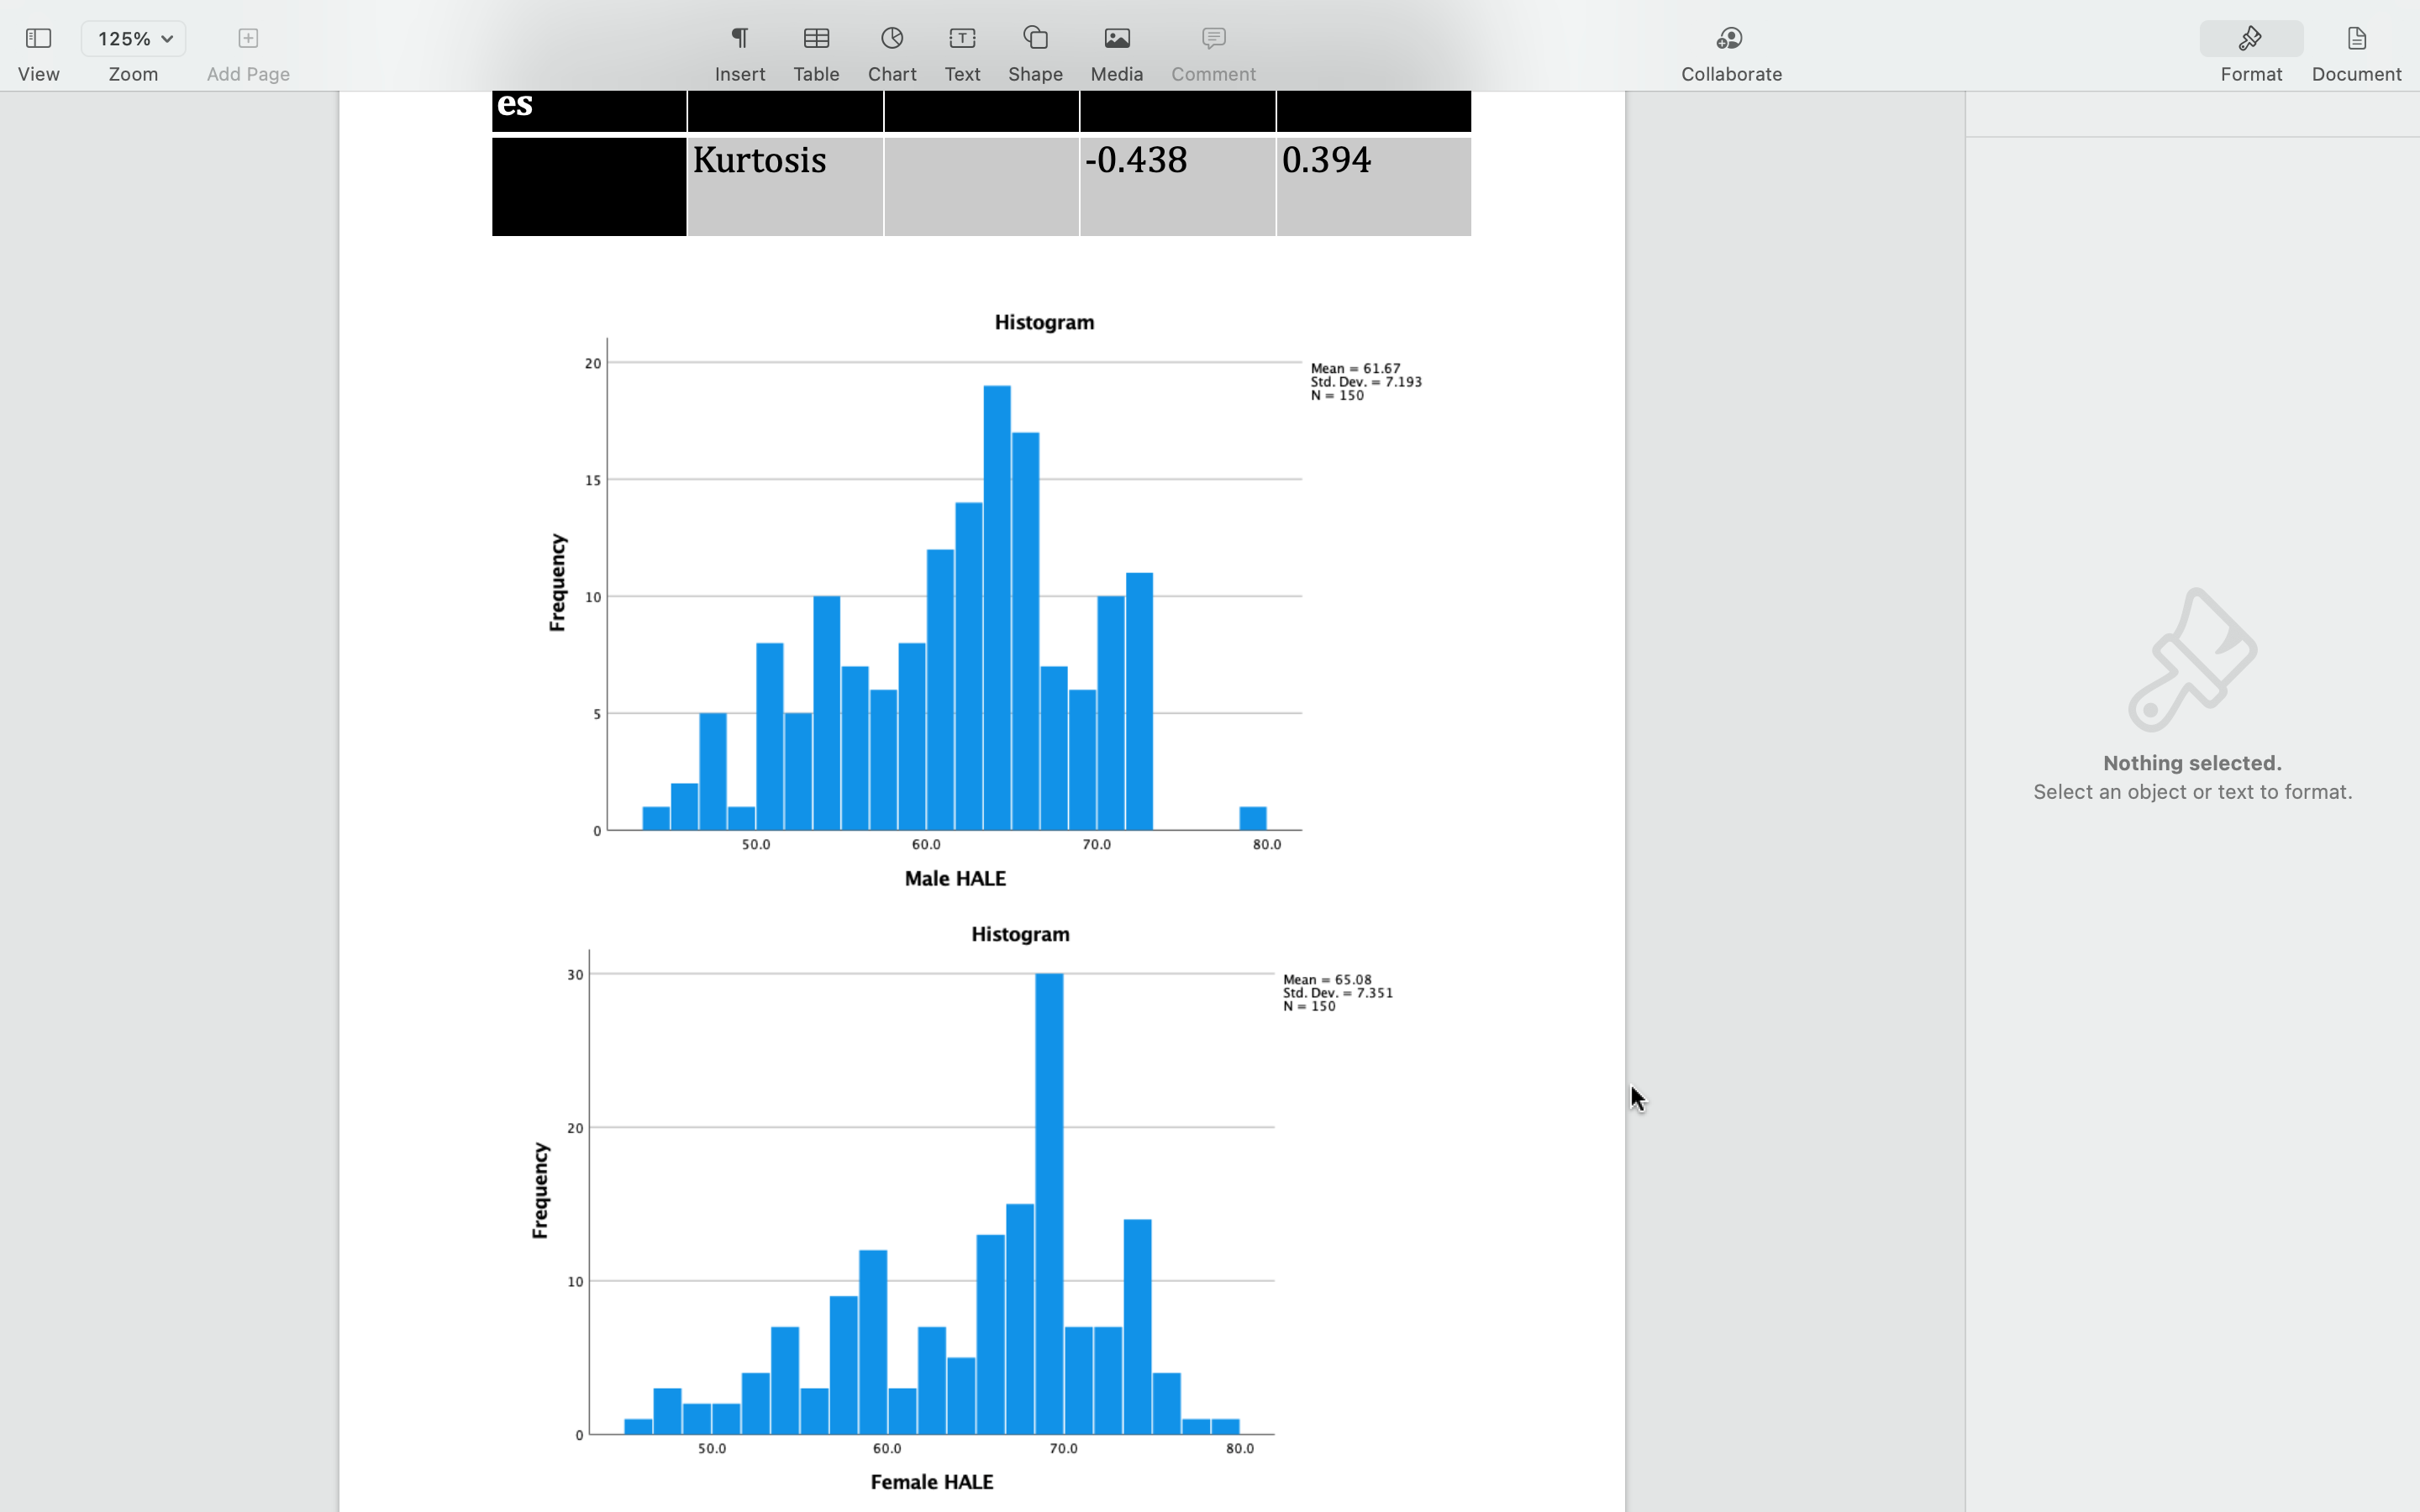
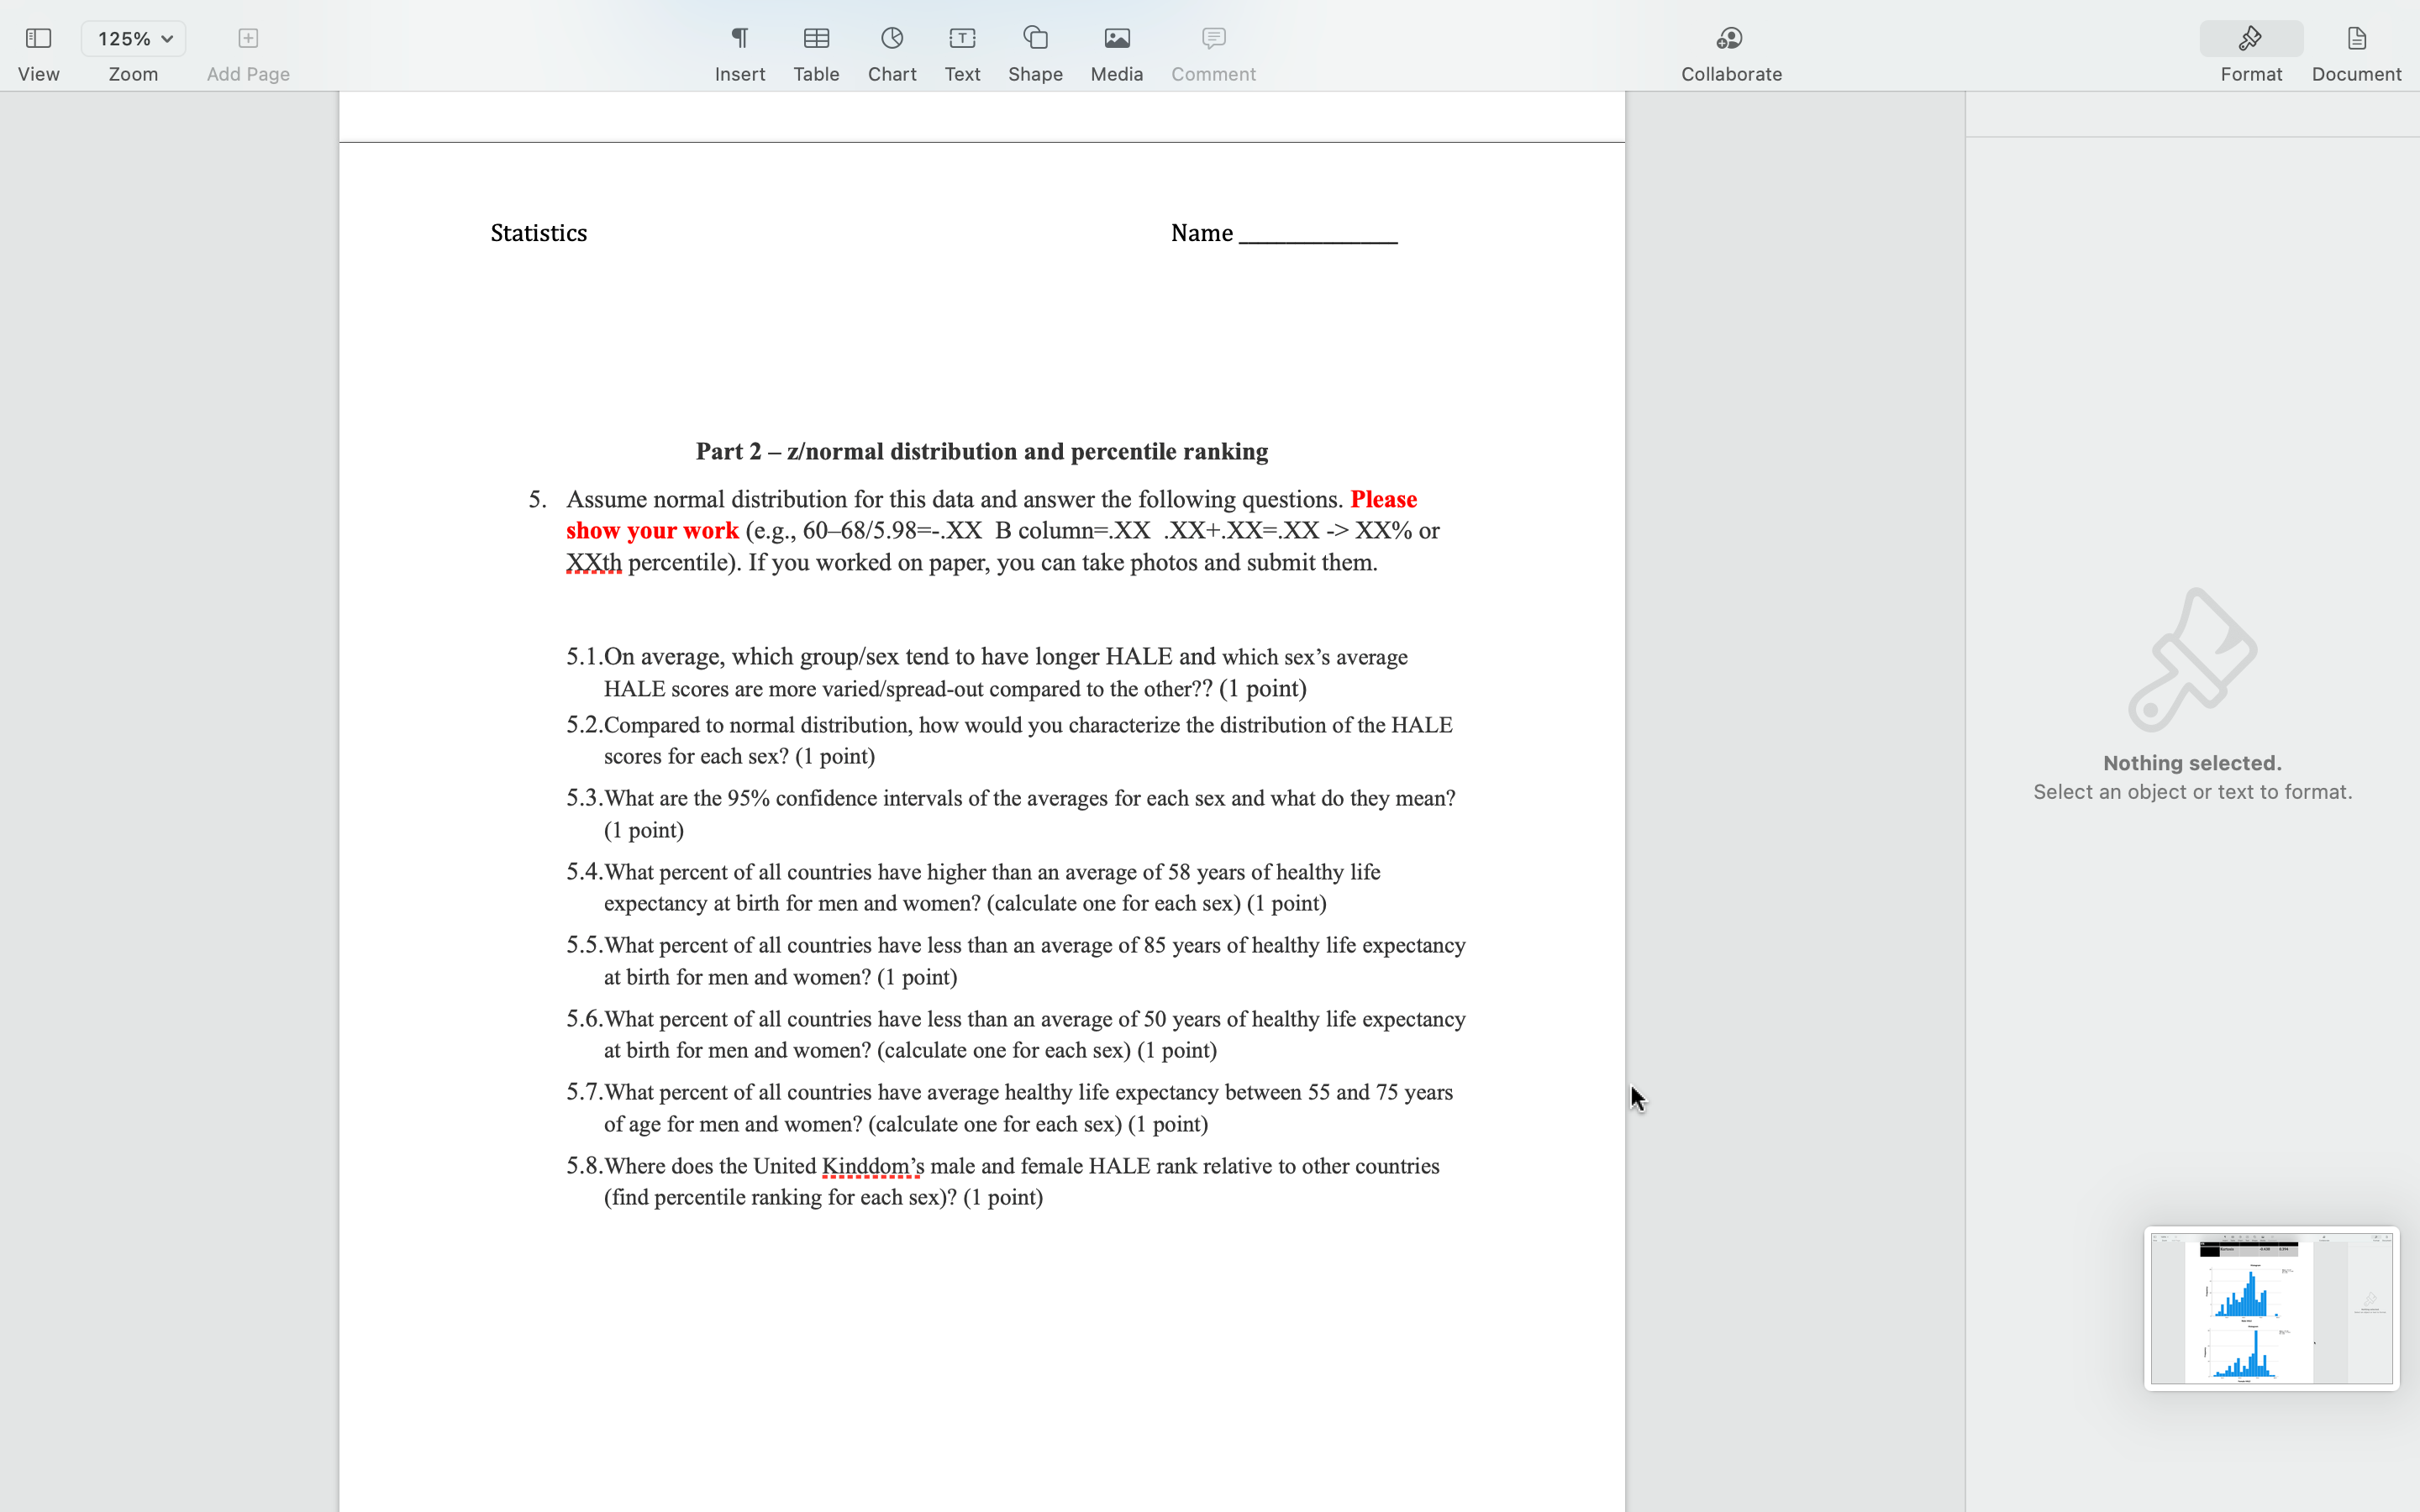
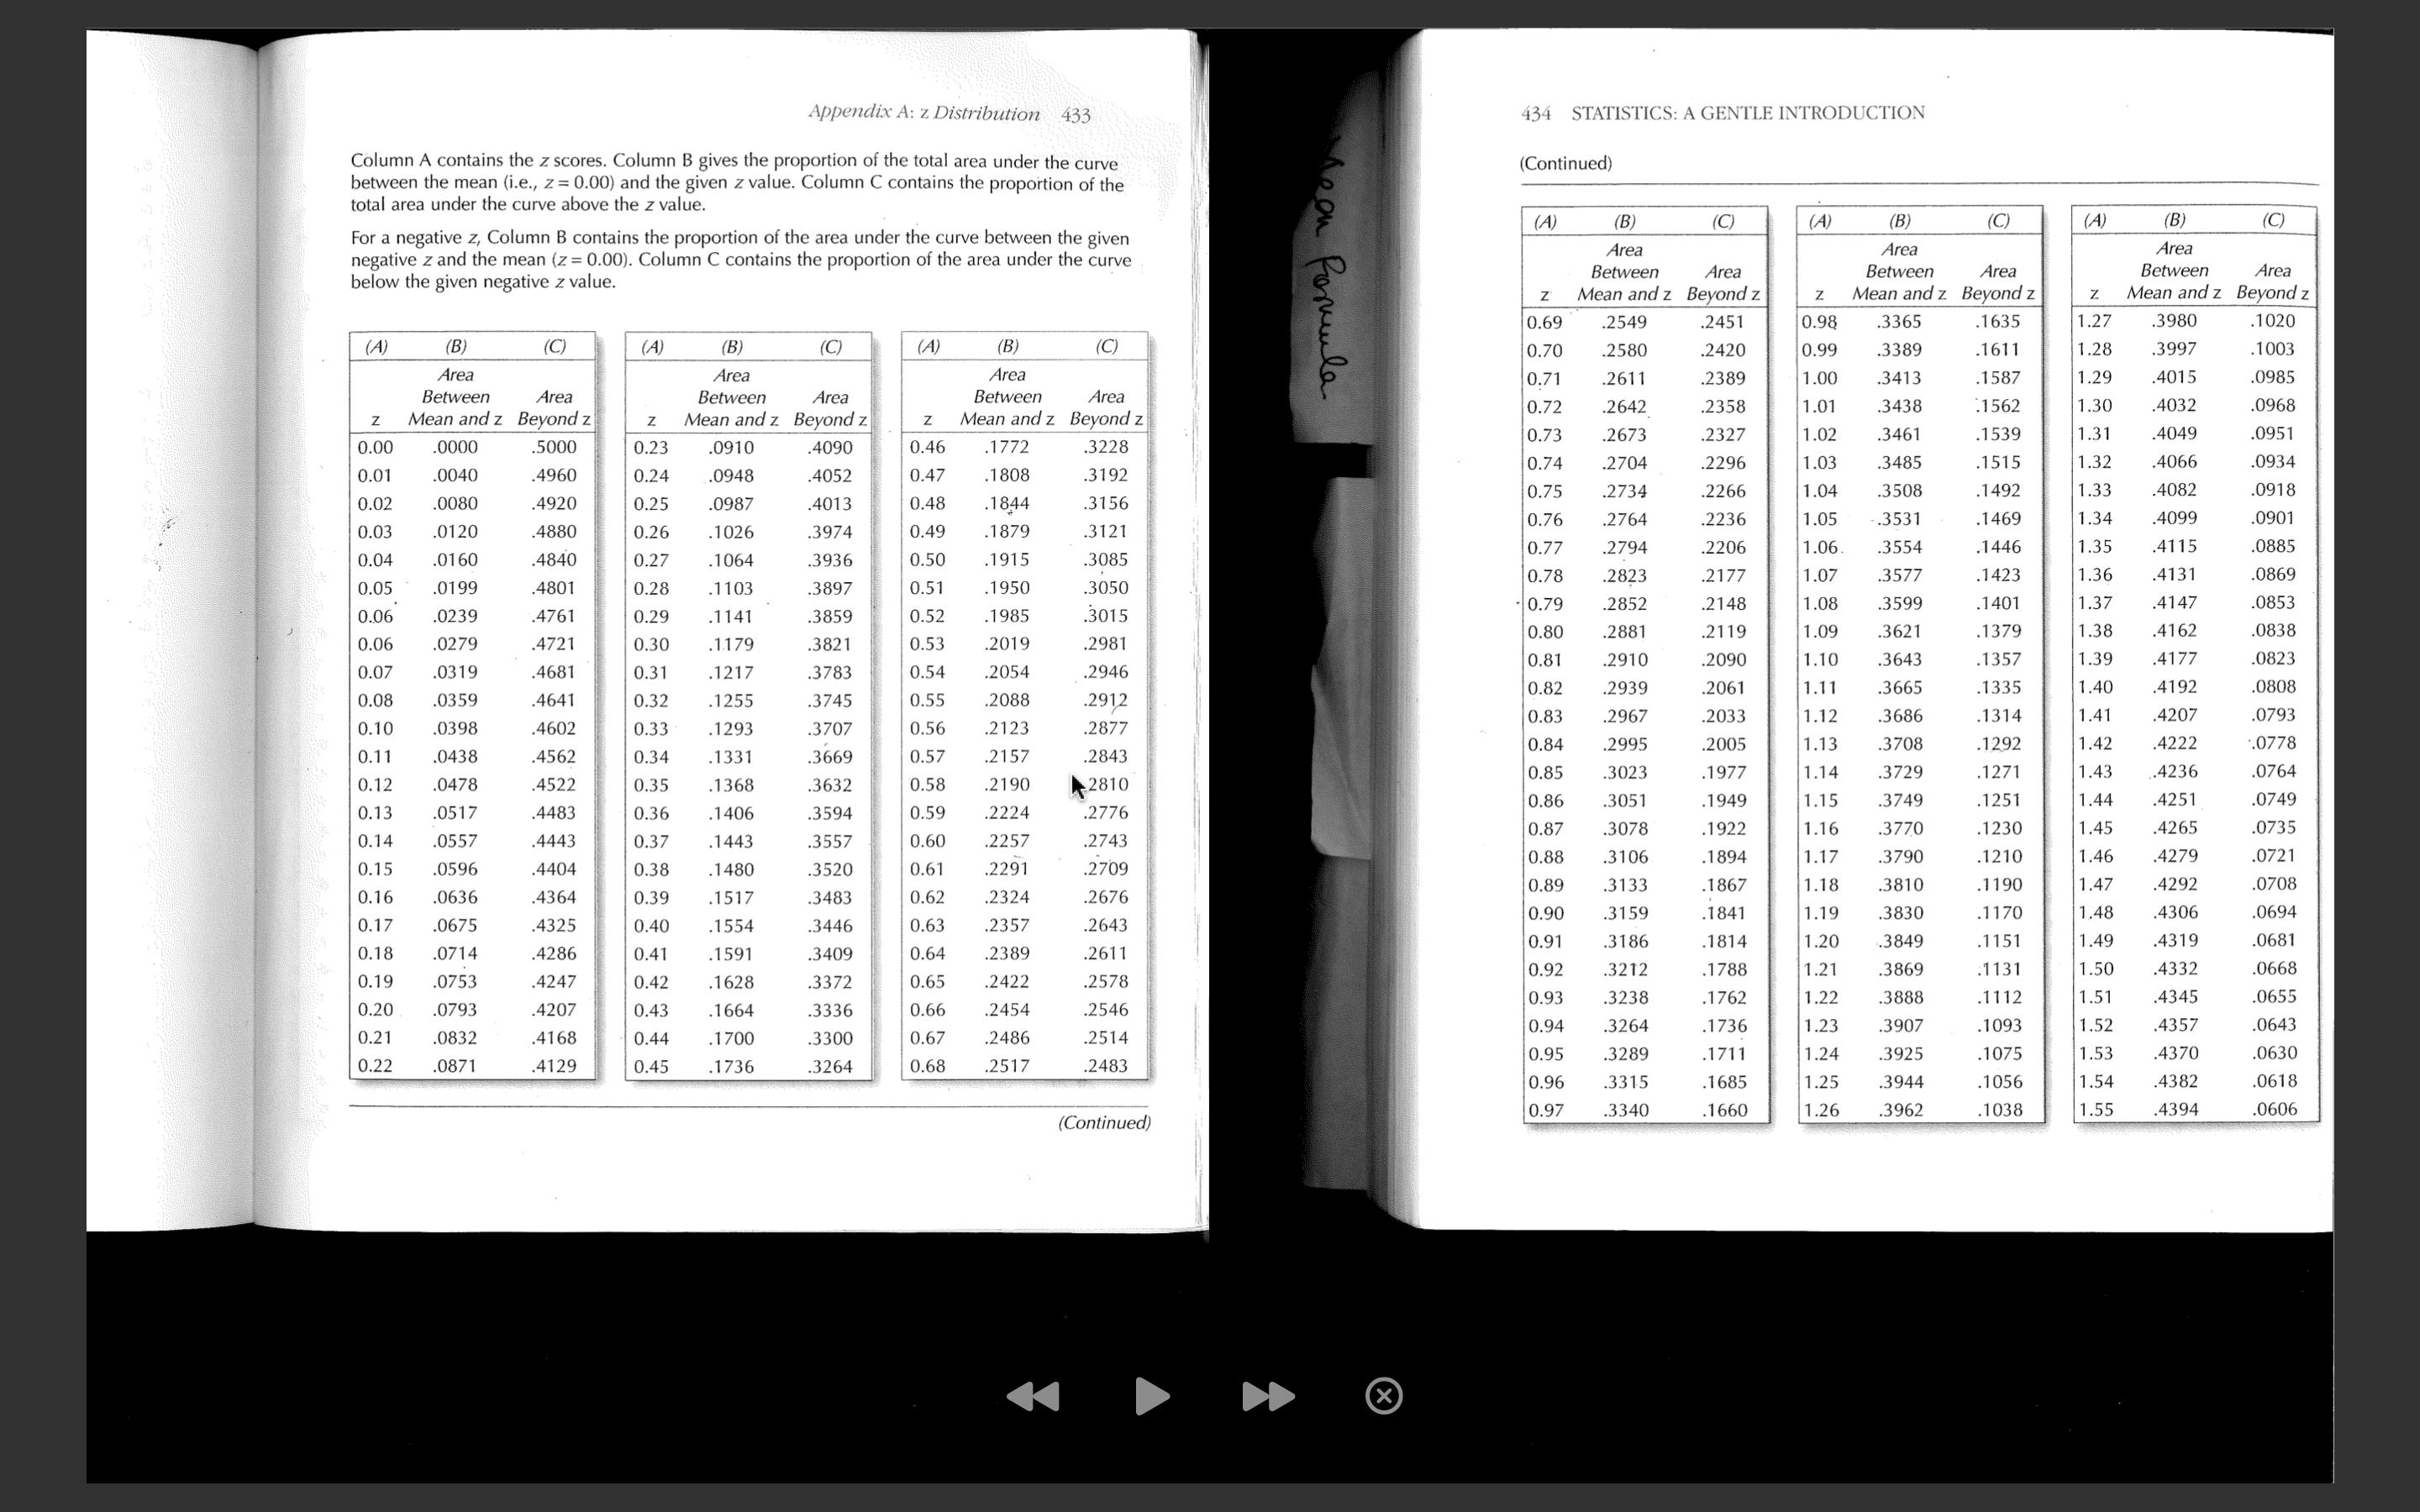
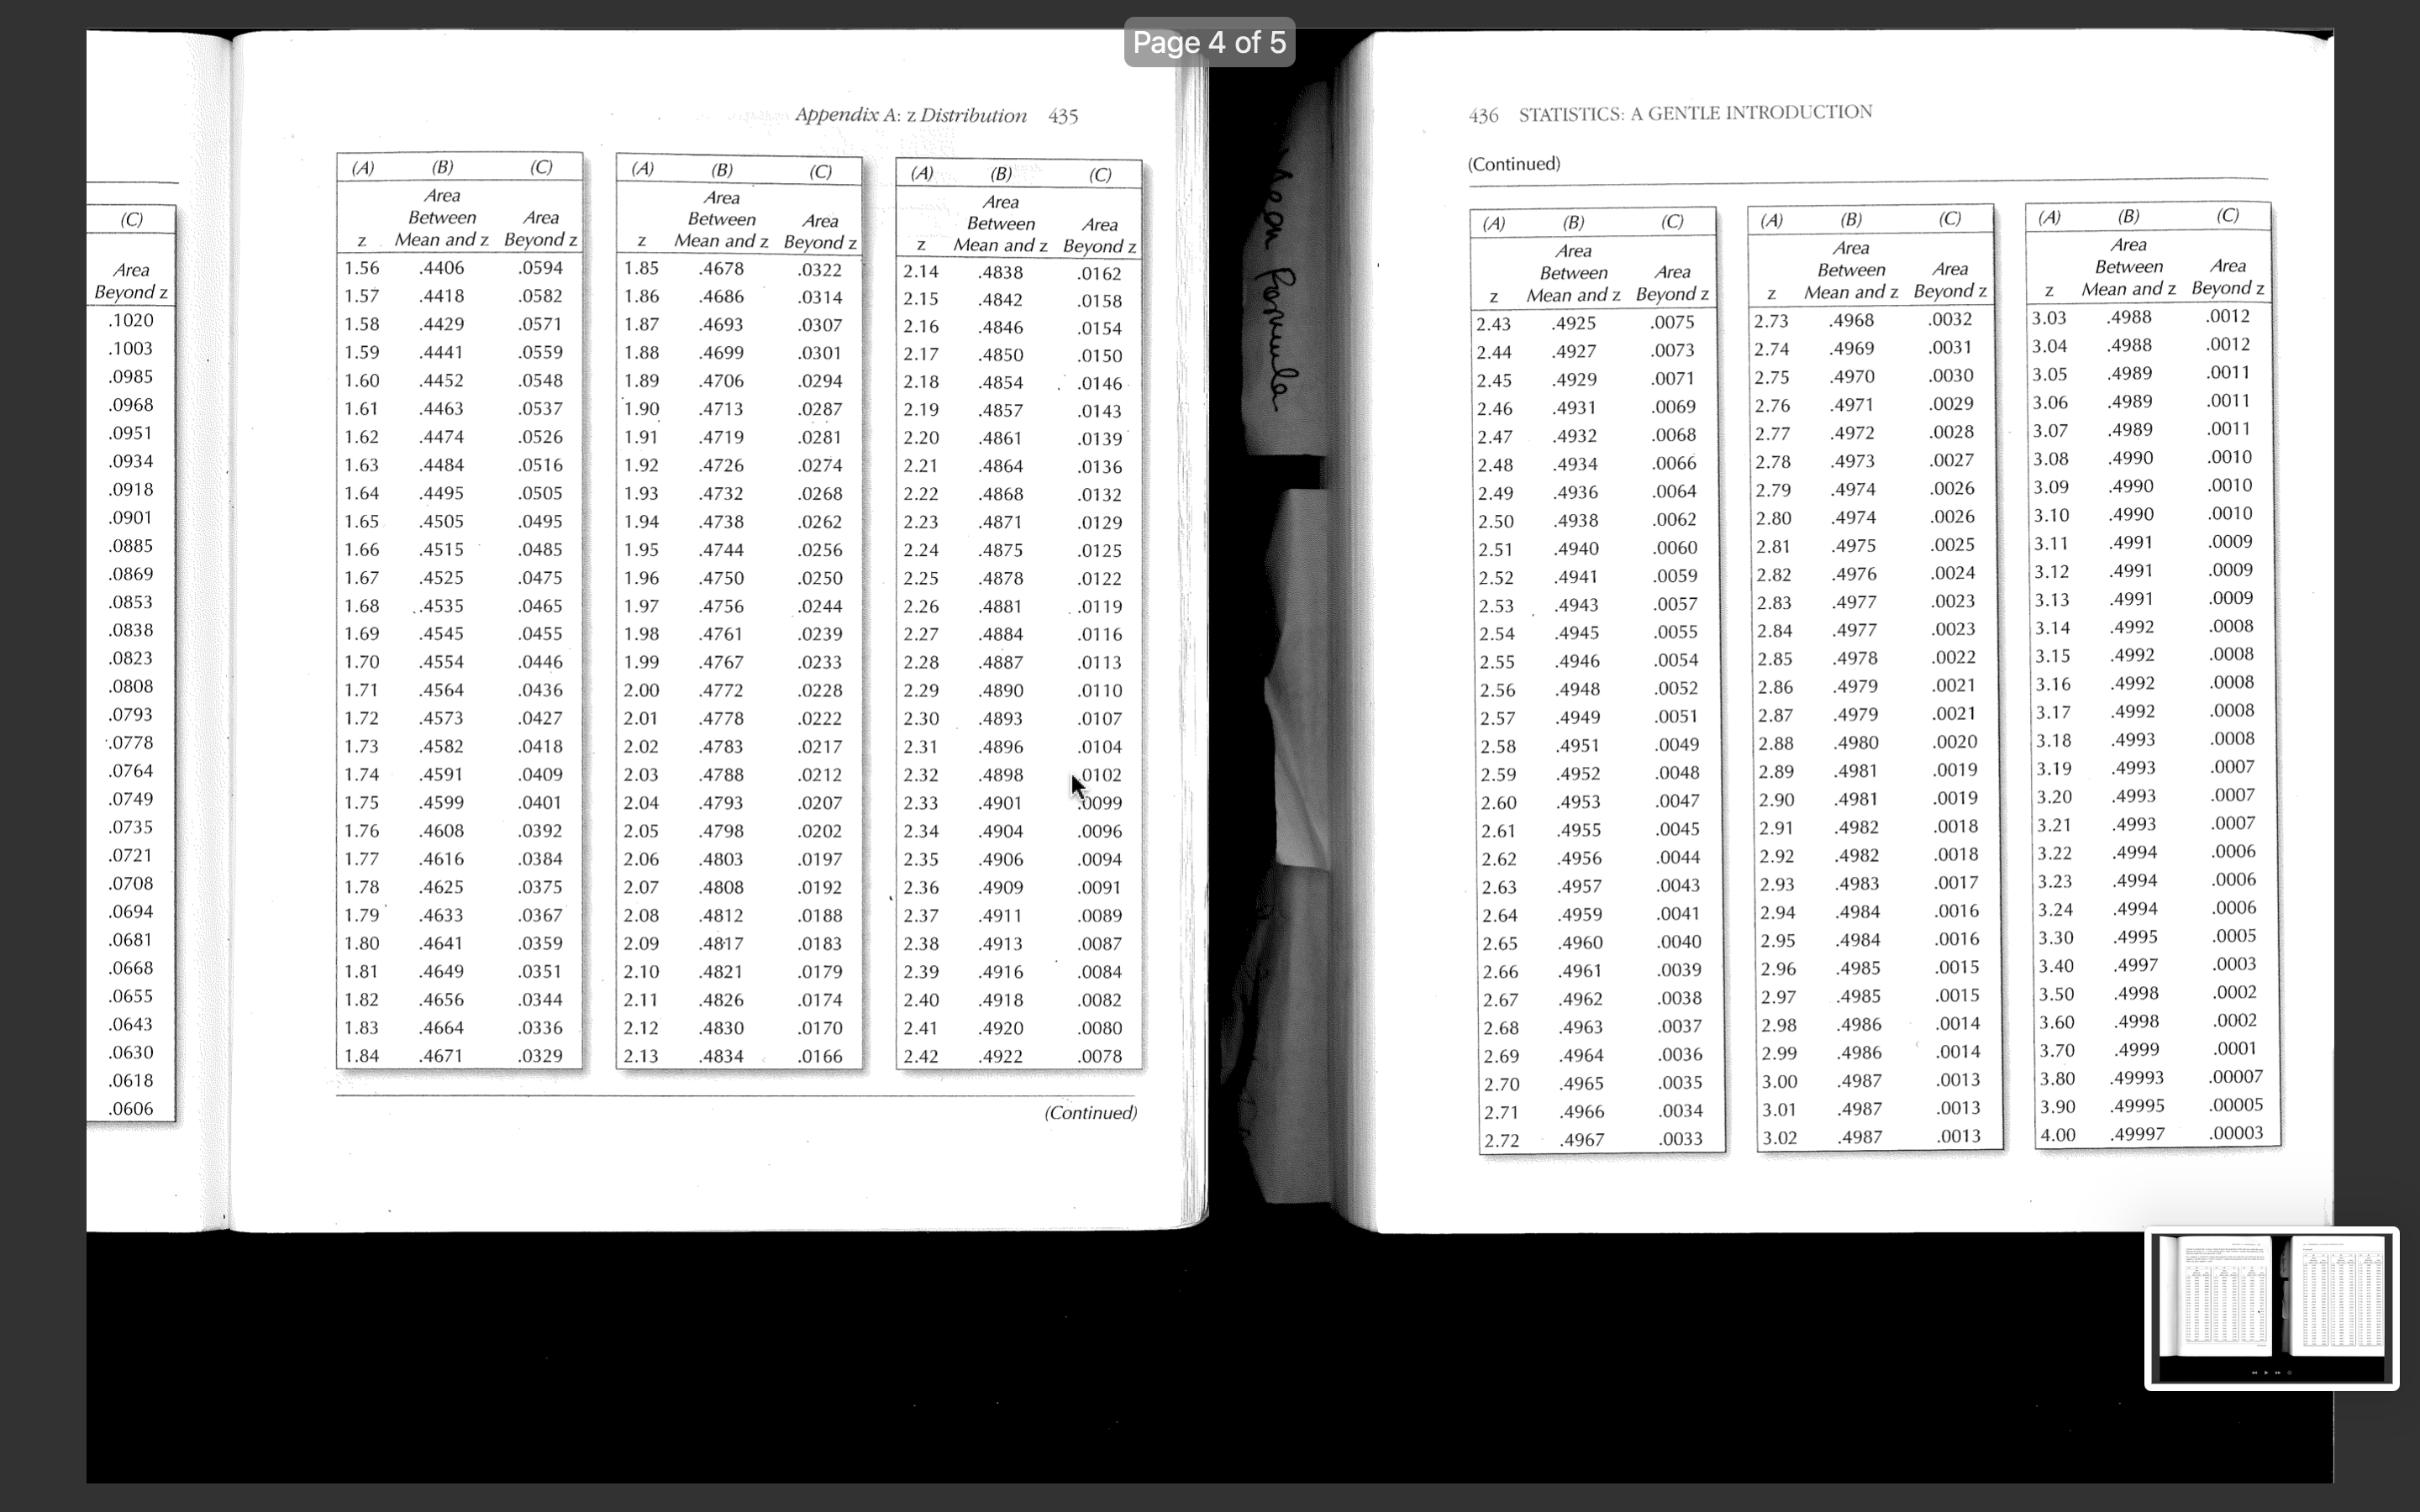
125% View Zoom Add Page Insert Table Chart Text Shape Media Comment Collaborate Format Document Add breaks, page numbers, links, and more. In this assignment, using the ricanuly LIC Expectancy (MALE) at birth data from a sample of 150 countries, you will learn to import excel data file into SPSS, become familiar with SPSS environment, define variable properties, calculate basic descriptive statistics, convert raw scores into z scores in SPSS, and practice using the z-distribution table and find percentile ranking. This assignment is divided into two parts. In the first part, you will learn some basic functions of SPSS and run descriptive tests and standardize raw scores. In the second part, you will calculate proportion of scores using the z-distribution table (Appendix A, page 432 of your textbook/Also posted in M2 Assignment page), and find percentile ranking. Part 1 - SPSS Practice 1. Import the excel file 'WHO HALE at birth 2016 male female sample 150.xlsx' into SPSS 2. Define variable properties. 3. Calculate measures of central tendency, measures of variation, skewness, kurtosis, and confidence interval of the means for each sex. Copy and paste all relevant tables and graphs. 4. Standardize the HALE scores for each country. In other words, convert raw scores into z scores. Nothing selected. Descriptiv Select an object or text to format. es Statistic Std. Error Male Mean 61.671 0.5873 HALE 95% Lower 60.511 Confidence Bound Interval for Mean Upper 62.832 Bound125% EB Collaborate Format Document Comment View Zoom Add Page Insert Table Chart Text Shape Media Statistics Name Descriptiv es 5% 61.871 Trimmed Mean Median 62.950 Variance 51.735 Std. 7.1927 Deviation Minimum 43.9 Nothing selected. Select an object or text to format. Maximum 78.8 Range 34.9 Interquarti 10.2 le Range Skewness -0.355 0.198 Kurtosis -0.514 0.394 Female Mean 65.077 0.6002 HALEView 1 25% v Zoom Add Page r XX% or XXth percentile). If you worked on paper, you can take photos and submit them. 5.1.On average, which group/sex tend to have longer HALE and which sex's average HALE scores are more varied/spread-out compared to the other?? (1 point) 5.2.Compared to normal distribution, how would you characterize the distribution of the HALE scores for each sex? (1 point) Nothing selected. 5.3. What are the 95% confidence intervals of the averages for each sex and what do they mean? Select an object or text to format. (1 point) 5.4. What percent of all countries have higher than an average of 58 years of healthy life expectancy at birth for men and women? (calculate one for each sex) (1 point) 5.5. What percent of all countries have less than an average of 85 years of healthy life expectancy at birth for men and women? (1 point) 5.6. What percent of all countries have less than an average of 50 years of healthy life expectancy at birth for men and women? (calculate one for each sex) (1 point) 5.7. What percent of all countries have average healthy life expectancy between 55 and 75 years of age for men and women? (calculate one for each sex) (1 point) 5.8. Where does the United Kingdom's male and female HALE rank relative to other countries (find percentile ranking for each sex)? (1 point) LEAppendix A: z Distribution 433 434 STATISTICS: A GENTLE INTRODUCTION Column A contains the z scores. Column B gives the proportion of the total area under the curve (Continued) between the mean (i.e., z= 0.00) and the given z value. Column C contains the proportion of the total area under the curve above the z value. (A) (B (C) (A B) (C) (A B (C) For a negative z, Column B contains the proportion of the area under the curve between the given negative z and the mean (z = 0.00). Column C contains the proportion of the area under the curve Area Area Area below the given negative z value. Between Area Between Area Between Area Z' Mean and z Beyond z Mean and z Beyond z Z Mean and z Beyond z 0.69 .2549 .2451 0.98 3365 1635 1.27 .3980 .1020 (A) (C) (A) (B (A) B) (C) 0.70 .2580 2420 0.99 3389 1611 1.28 .3997 .1003 Area Area Area 0.71 .2611 .2389 1.00 .3413 .1587 1.29 1015 .0985 Between Area Between Area Between Area 0.72 .2642 .2358 1.0 3438 :1562 1.30 4032 .0968 z Mean and z Beyond z Mean and z Beyond z z Mean and z Beyond z 0.73 .2673 .2327 1.02 .3461 1539 1.31 .4049 0951 0.00 .0000 .5000 0.23 0910 4090 0.46 .1772 228 0.01 0.74 .2704 2296 1.0 4960 3485 .1808 .1515 1.32 4066 0934 .0040 ).24 0948 4052 0.47 .3192 1844 0.75 4920 0.48 .2734 2266 3508 1492 1.33 4082 0918 0.02 0080 0.25 0987 401 3156 0.76 .2764 .2236 1.05 .3531 .1469 1.34 4099 0901 0.03 .0120 4880 ).26 1026 3974 0.49 1879 .3121 0.77 .2794 .2206 1.06 0.04 3554 1446 .35 41 15 0885 0160 4840 .27 1064 393 0.50 1915 .3085 0199 0.78 .2823 .2177 1.07 .3577 1423 1.36 .4131 .0869 0.05 4801 0.28 1103 .3897 0.51 1950 3050 0.06 0.79 3599 1401 1.37 4147 .0853 0239 4761 .29 .1141 385 0.52 1985 .3015 .2852 2148 0.80 .2881 211 1.0 3621 1379 1.38 .4162 .0838 0.06 0279 4721 0.30 1.179 .3821 0.53 2019 2981 0.07 319 378 0.54 0.81 .2910 .2090 1.10 .3643 .1357 1.39 4177 0823 4681 .3 1217 2054 .2946 0.82 .2939 2061 1.11 3665 1335 1.40 4192 0808 0.08 0359 .4641 0.32 1255 .3745 0.55 .2088 .2912 0.83 296 2033 1.12 .3686 1314 1.41 4207 .0793 0.10 .0398 4602 0.33 1293 3707 0.56 2123 .2877 1.13 1.42 4222 .0778 0.11 .0438 0.34 .3669 .2995 .2843 3708 1331 2157 0.84 .2005 1292 .4562 0.57 0.85 302 197 1.14 .3729 .127 1.43 .4236 0764 0.12 .0478 4522 0.35 1368 .3632 0.58 .2190 2810 3749 1251 1.44 4251 0749 0.13 0517 .3051 .4483 3594 0.59 .2224 .2776 0.86 1949 1.15 0.36 140 0.87 .3078 1922 1.16 .3770 1230 1.45 4265 .0735 0.14 .0557 4443 0.37 1443 .3557 0.60 .2257 .2743 3790 1.46 4279 0721 0.15 .0596 4404 0.38 148 3520 0.61 229 2709 0.88 3106 . 1894 1.1; 1210 .3133 1867 1.18 3810 .1190 1.47 4292 708 0.16 .0636 .4364 0.39 0.89 1517 .3483 0.62 .2324 .2676 0.90 3159 1841 1.19 .3830 1170 1.48 4306 0694 0.17 0675 4325 0.40 1554 .3446 0.63 2357 2643 0.91 .3186 1814 1.20 3849 1151 1.49 4319 0681 0.18 0714 .4286 0.41 1591 .3409 0.64 .2389 2611 0.92 .3212 1788 1.2 3869 1131 1.50 .4332 0668 0.19 .0753 4247 0.42 1628 .3372 0.65 .2422 .2578 0.20 0793 .4207 0.43 0.66 .2546 0.93 1.2 3888 1.51 4345 .0655 1664 3336 .3238 .2454 1762 1112 0.94 .3264 1.2 3907 1093 1.52 4357 .0643 0.21 .0832 .4168 0.44 .1700 .3300 0.67 1736 .2486 .2514 0.95 .3289 .1711 1.24 .3925 0630 .0871 0.45 1075 1.53 4370 0.22 .4129 1736 .3264 0.68 .2517 .2483 0.96 .3315 1685 1.25 3944 1056 1.54 4382 0618 0.97 .3340 .1660 1.26 3962 1038 1.55 .4394 .0606 (Continued) XPage 4 of 5 Appendix A: z Distribution 435 436 STATISTICS: A GENTLE INTRODUCTION (A) (B) (C) (A (B) (C) (A) (B) (C) (Continued) Area Area Area Wooy (C) Between Area Between Area Between Area (A) (B) (C) (A (B) (C) (A) (B (C) Mean and z Beyond z Mean and z Beyond z Mean and z Beyond z Area Area Area Area 1.56 .4406 0594 1.8 4678 .0322 2.14 .4838 .0162 Between Area Between Area Between Area Beyond z 1.57 .4418 0582 1.86 4686 0314 2.15 .4842 .0158 Mean and z Beyond z z Mean and z Beyond z Mean and z Beyond z 1020 1.58 4429 0571 0012 1.87 4693 0307 2.1 3.03 498 4846 .0154 2.43 4925 0075 2.73 4968 .0032 Romeula .1003 1.59 4441 559 1.88 4699 .0301 2.17 4850 0150 2.44 .4927 0073 2.74 4969 .0031 3.04 .4988 0012 .0985 1.60 4452 0548 80 4706 .0294 2.18 1854 .0146 2.45 4929 007 2.75 4970 .0030 3.05 4989 001 0968 1.61 .4463 0537 .90 4713 0287 2.19 4857 0143 2.46 4931 0069 2.76 4971 .0029 3.06 4989 001 .0951 1.62 4474 0526 .91 4719 0281 2.20 4861 139 2.47 4932 0068 2.77 4972 .0028 3.07 4989 001 0934 1.63 .4484 0516 .92 4726 0274 2.21 4864 2.48 4934 0066 2.78 4973 .0027 3.08 4990 0010 0136 0918 1.64 4495 0505 9 4732 0268 2.22 4868 0132 2.49 4936 0064 2.79 4974 .0026 3.09 4990 001 090 1.65 .4505 0495 1.94 4738 .0262 2.23 4871 129 2.50 4938 006 2.80 4974 0026 3.10 4990 001 088 1.66 4515 .048 1.95 4744 256 2.24 4875 0125 2.51 4940 0060 2.81 4975 0025 3.1 4991 009 .0869 1.67 4525 0475 .96 4750 0250 2.25 4878 0122 2.52 4941 0059 2.82 4976 .0024 3.12 4991 009 0853 1.68 .4535 0465 4991 1.97 4756 024 2.26 4881 .0119 2.53 .4943 0057 2.83 4977 .0023 3.13 .0009 .0838 1.69 4545 0455 198 4761 0239 2.27 4884 0116 2.54 4945 0055 2.84 497 .0023 3.14 4992 000 0823 1.70 .4554 .0446 1.99 4767 233 2.28 4887 0113 2.55 494 0054 2.85 1978 0022 3.15 4992 0008 080 1.71 4564 043 2.00 4772 .0228 2.29 4890 0110 2.56 4948 0052 2.86 1979 .0021 3.16 4992 0008 0793 1.72 .4573 0427 2.01 4778 0222 2.30 4893 0107 2.57 4949 .0051 2.87 4979 .0021 3.17 4992 000 .0778 1.73 .4582 0418 2.02 4783 0217 2.31 4896 104 2.58 4951 0049 2.88 1980 .0020 3.18 4993 0008 .0764 1.74 4591 040 2.03 4788 0212 2.32 898 0102 2.59 4952 04 2.89 498 0019 3.19 499 200 074 1.75 4599 0401 2.04 4793 .0207 2.33 4901 0099 2.60 4953 0047 2.90 4981 0019 3.20 4993 0007 0735 1.76 4608 0392 2.05 4798 0202 2.34 4904 0096 2.61 4955 0045 2.91 .4982 0018 3.21 4993 0007 0721 1.77 4616 0384 2.06 4803 019 2.35 4906 0094 2.62 4956 0044 2.92 .4982 .0018 3.22 499 0006 .0708 1.78 4625 0375 2.07 4808 0192 2.36 4909 091 2.63 4957 0043 2.93 4983 .0017 3.23 4994 .0006 .0694 1.79 4633 0367 2.08 4812 188 2.37 4911 .0089 2.64 4959 .0041 2.94 4984 016 3.24 499 0006 068 1.80 464 359 2.09 4817 0183 2.38 4913 0087 2.65 4960 0040 2.95 4984 0016 3.30 499 0005 .0668 1.81 4649 0351 2.10 4821 0179 2.39 4916 0084 2.66 4961 003 2.96 .4985 .0015 3.40 4997 0003 0655 1.82 4656 .0344 2.11 4826 0174 2.40 4918 0082 2.67 4962 1038 2.97 4985 0015 3.50 4998 .0002 .0643 1.83 4664 0336 2.12 4830 0170 2.41 4920 080 2.68 4963 .0037 2.98 4986 .0014 3.60 4998 0002 0630 1.84 .467 .0329 2.13 4834 0166 2.42 .4922 0078 2.69 4964 036 2.99 4986 0014 3.70 4999 0001 0618 2.70 4965 0035 3.0 4987 0013 3.80 49993 00007 .0606 Continued) 2.71 .4966 0034 3.01 4987 .0013 3.90 49995 00005 2.72 4967 .0033 3.02 4987 .0013 4.00 .49997 .00003
Step by Step Solution
There are 3 Steps involved in it

Get step-by-step solutions from verified subject matter experts